Contents
AUSTRALIA'S HEALTHCARE SYSTEM: A ‘SICKCARE’ SYSTEM
How much does Australia spend on healthcare?
Is Australia’s healthcare spending effective?
THE CASE FOR INVESTING IN HEALTHCARE
Investing in healthcare increases economic output
Investing in healthcare improves lives
Investing in healthcare saves money
FOREWORD
 While Australia has made significant gains in life expectancy, many of us are spending more and more years living with ill-health. Chronic disease is now the leading cause of illness, disability, and death in Australia, with almost half of all Australians living with at least one chronic disease. In addition, patients are now waiting longer than ever for care, due to health workforce shortages, increased demand for care, and a backlog greatly worsened by the COVID-19 pandemic. We are now seeing patients presenting with more advanced disease and conditions as a direct result of missed opportunities for prevention and early intervention.
The costs of poor health are significant. Patients suffer physically and mentally, and often financially, with their quality of life diminished. Their burden is also shared by their friends, families, and communities. These costs extend even further — to a healthcare system already struggling to meet demand, to governments burdened with subsidising the increasing cost of care, and to an economy already bracing for reduced workforce participation due to our ageing population.
The pervasive impact of poor health is widely acknowledged, yet governments continue to view healthcare as a cost to be managed, rather than an investment to be made ― a paradigm that has inadvertently shaped a ‘sickcare’ system rather than an holistic healthcare system that tackles both existing health issues and prioritises prevention. The time has come to reframe our thinking.
Two years ago, the AMA launched its Vision for Australia’s Health, which set out a commitment to develop costed and implementable solutions to make Australia the healthiest country in the world. This report demonstrates that the AMA has followed through on that promise, providing a blueprint for shifting Australia’s healthcare system from ‘sickcare’ to holistic healthcare.
Achieving such a change will require the collective effort of policymakers, healthcare professionals, community leaders, and patients to shape future policy that recognises health as a strategic investment. We will also need to look at economic productivity as more than just macroeconomic measures, but rather through a comprehensive lens that encompasses the broader dimensions of quality of life, wellbeing, and a thriving society.
By embracing the principle of this report ― that health is the best investment we can make ― we can forge a path together toward a healthier and more productive Australia.

Professor Steve Robson
Federal AMA President
EXECUTIVE SUMMARY
Improving the health outcomes of Australians is not only a desirable objective in its own right, but an important determinant for Australia’s economic productivity and growth. There is an extensive body of global evidence that demonstrates healthy people are more likely to participate in the workforce, contribute to society, spend into the economy, and require less expensive care. AMA analysis presented in this report reveals that workforce participation is higher than what was projected by government, largely due to sustained and growing engagement of workers aged 55 years and older. It is estimated that this increased engagement accounts for a 2.5 per cent (an estimated $57.3 billion) increase in Gross Domestic Product (GDP) over the last 14 years, which can largely be attributed to a combination of strong labour policies and improved health. Additionally, we have seen first-hand the impact of poor health, with the COVID-19 pandemic showing us that without good health, we cannot function as individuals or as a society.
While governments recognise the importance of good health, they continue to view healthcare in Australia as a cost rather than an investment. This is particularly clear when it comes to investment in prevention and early intervention, with spending on preventative health in Australia remaining low by Organisation for Economic Co-operation and Development (OECD) standards ― less than two per cent of health expenditure, and around 1.5 per cent in 2018–19 and 2019–20.1 Additionally, while access to healthcare services has been an issue in Australia for many years, COVID-19 has exacerbated this issue, with delays in appointments and procedures creating a significant backlog of care. Australia’s inability to address this issue in a timely way has created missed opportunities for prevention and early intervention, resulting in patients presenting with more advanced disease and comorbidities that are a direct result of delayed care, ultimately making it more challenging and more costly to deliver care.
The view that health is a cost to be managed, as opposed to an investment to be made, has resulted in a healthcare system that responds to poor health outcomes rather than actively preventing them ― a ‘sickcare’ system rather than a holistic healthcare system that tackles both existing health issues and prioritises prevention. Australia is facing major health workforce shortages, increased demand, the aftermath of COVID-19 including delayed care and long COVID, and rising costs of providing healthcare. Additionally, the ability for Australia to maintain high workforce participation ― and therefore high economic output ― will be challenging in light of an ageing population with increased chronic disease. Now is the time to reframe our thinking and expand our focus from sickcare to holistic healthcare, with governments looking at how healthcare expenditure can be maximised to improve health outcomes and support economic growth.
Achieving this goal will require both increased expenditure and improved efficiency, and the collective effort of policymakers, healthcare professionals, community leaders and patients. It will also require governments to adopt a more comprehensive approach to healthcare investment that extends beyond short-term political cycles and looks at broader economic outcomes, such as quality of life, wellbeing, and a thriving society.
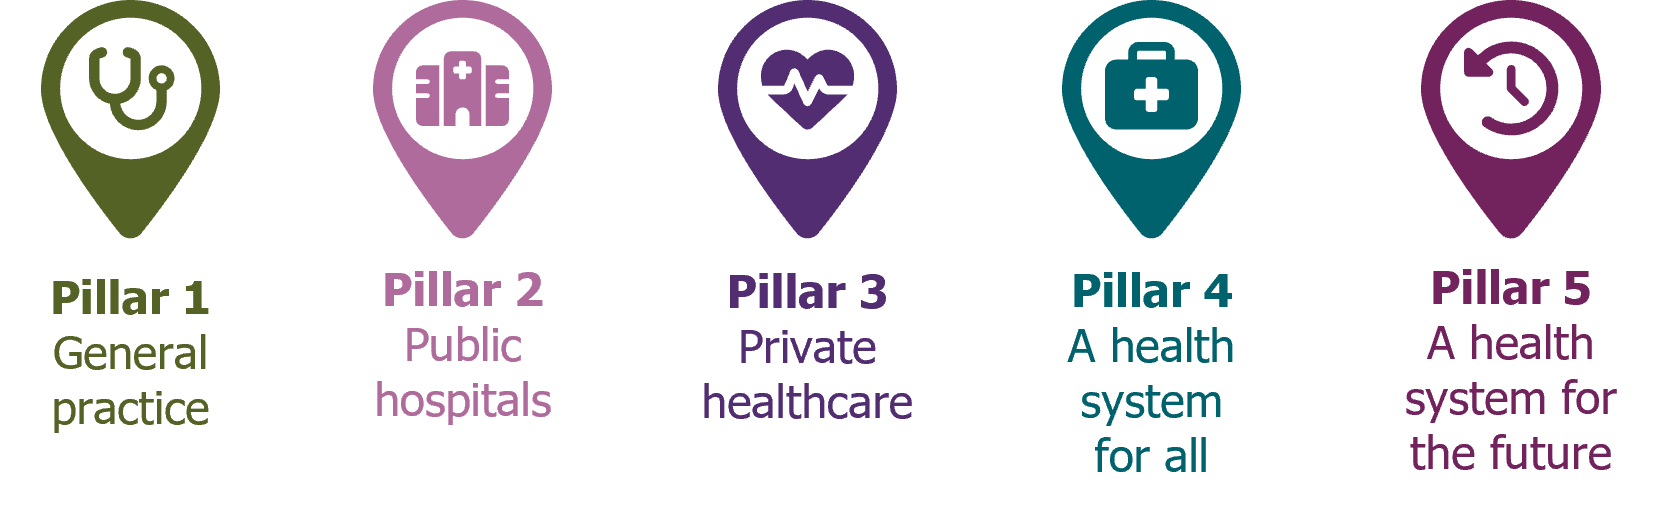
The AMA Vision for Australia’s Health provides a blueprint for healthcare investment across five pillars: general practice, public hospitals, private health, a health system for all, and a health system for the future. This report outlines several costed, targeted, and implementable initiatives that demonstrate why health is the best investment governments can make. It is clear from these examples that investing in health ― whether it be in public health, primary care, public hospitals, private health, or future reform ― is an investment in our future and the wisest decision we can make as a nation. The AMA is committed to working with governments, healthcare professionals, and communities to achieve this paradigm shift in how we perceive and prioritise health.
 |
|
 |
|
 |
|
 |
|
 |
|

AUSTRALIA’S HEALTHCARE SYSTEM
A ‘sickcare’ system
The inherent value of health is widely acknowledged and constitutes a fundamental aspect of our lives. The absence of good health not only diminishes an individual’s quality of life, but also impairs their capacity to perform essential activities, partake in social interactions, and contribute to the workforce. Additionally, the repercussions of health problems extend beyond the individual level, as they impact our friends, families, communities, as well as the healthcare system and broader economy.
How much does Australia spend on healthcare?
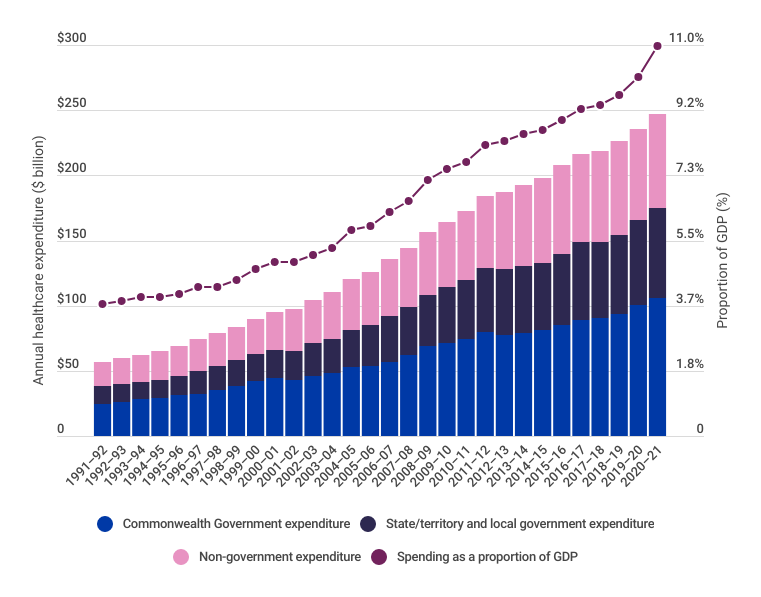
Health expenditure makes up one of the largest portions of federal, state, and territory government budgets. As a nation, Australia spent $247.4 billion (2023 dollars) on health in 2020–21, equating to approximately $9,631 per person and 10.9 per cent of Gross Domestic Product (GDP).2 Around $175.7 billion of this was directly funded by government, with the remaining $72.6 billion funded by non-government entities, individuals, private health insurers, and injury compensation insurers.3
Annual healthcare expenditure has been increasing year-on-year, with expenditure in 2020–21 over four times higher (2023 dollars) than in 1991–92 (Figure 1). While healthcare expenditure as a proportion of GDP has also been increasing ― largely due to a growing and ageing population that is developing more complex and chronic disease ― funding for healthcare as a portion of the federal budget has remained between 15 per cent and 17 per cent for the last 30 years.4,5,6
Figure 1: Annual healthcare expenditure (2023 dollars), 1991–92 to 2020–217
Is Australia’s healthcare spending effective?
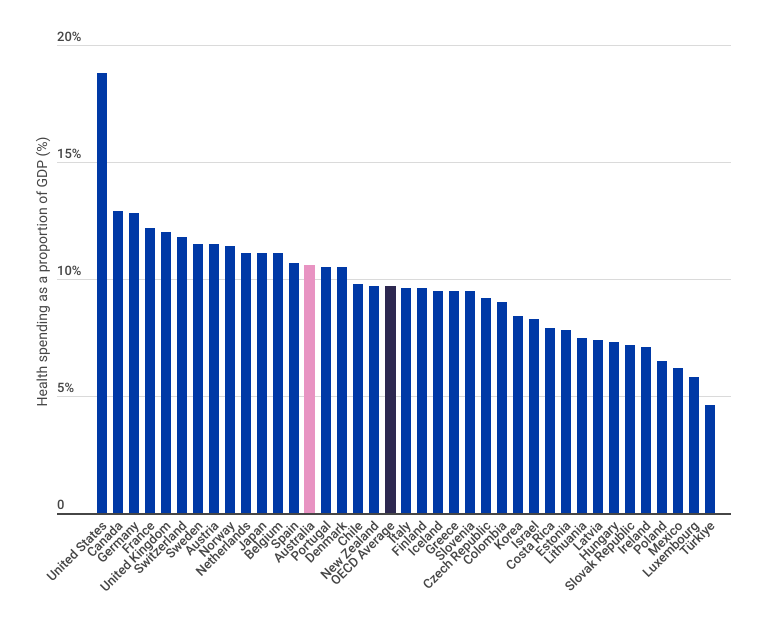
Compared with other Organisation for Economic Co-operation and Development (OECD) countries,i Australia’s healthcare system appears to be cost effective, with lower healthcare spending as a proportion of GDP compared with many other OECD countries ― including key peer countries Canada, France, and the United Kingdom ― for comparable or better life expectancy (Figure 2).8,9 Ranking fifth in the OECD with an average life expectancy of 83.2 years,10and third in the Commonwealth Fund’s comparison of 11 high-income country healthcare systems,11the Australian healthcare system is considered to be one of the best compared to other developed countries.
Average life expectancy however is only one measure of health outcomes and is often considered to be a superficial measure as it does not capture factors such as quality of life, disease burden, disability, wellbeing, health inequalities. While Australia has a high life expectancy, it also has a high number of years spent in ill-health compared to other OECD countries,12 and is lagging compared to other countries when it comes to factors such as prevention of chronic disease and access to timely care.
Figure 2: OECD healthcare expenditure as a proportion of GDP, 202013
The increasing burden of chronic disease in Australia
Chronic diseases (also referred to as non-communicable diseases) are the leading cause of illness, disability, and death in Australia.14 Almost half of all Australians live with at least one chronic disease, and one in five live with two or more chronic conditions.15 Further outlined in the Australian Burden of Disease Study, the last few years have seen a shift in burden of disease from fatal to non-fatal diseases, with many of these non-fatal diseases being chronic or long-lasting conditions.16
While some chronic diseases are difficult to prevent, such as those with an underlying genetic basis, much of the chronic disease burden in Australia is preventable through modification of risk factors such as physical inactivity, poor nutrition, obesity, hypertension, smoking and vaping, and excessive alcohol consumption. For example, despite the strong link with chronic diseases and other health issues, Australia has the seventh highest prevalence of obesity in the OECD.17 Additionally, rates of smoking and risky alcohol consumption remain high,18 and vaping has more recently emerged as a significant risk factor for chronic disease,19 particularly amongst younger populations.20,21
These modifiable risk factors are a significant contributor to preventable chronic disease in Australia, with nine out of 10 preventable deaths in Australia associated with chronic disease.22 Despite this burden of potentially preventable disease, spending on preventive health in Australia remains low by OECD standards ― less than two per cent of health expenditure, and around 1.5 per cent in 2018–19 and 2019–20.23There are several interrelated reasons for this lack of investment, including:
- investment in prevention often does not show immediate returns
- short-term political cycles incentivise initiatives that will deliver demonstrable short-term rewards, as opposed to long-term benefits
- there are challenges in collating the evidence to determine what preventive measures have the greatest efficacy
- there are several piecemeal sources of funding for preventative health across the various levels of government, reducing the ability to determine the return on investment
- the loss of the Australian National Preventative Health Agency — an independent agency focused on providing evidence-based advice to Commonwealth and state and territory governments on preventative health and the effectiveness of interventions — in 201424
- healthcare needs and outcomes are not uniform across the Australian population
- the complexity of social determinants of health
- preventative health programs often consist of a variety of different initiatives, leading to challenges in identifying those which are most successful.25
Accessing timely healthcare
Access to timely and affordable healthcare is fundamental in preventing, treating, and managing health conditions. Access to healthcare services has been an issue in Australia for many years and can be attributed to a complex interplay of geographical, cultural, social, and demand/supply barriers. This issue was only exacerbated by the COVID-19 pandemic, with delays in appointments and procedures creating a significant backlog of care.
We are now at a point where more than one in three patients will wait longer than the clinically recommended 30 minutes to receive urgent care in the emergency department.26 One in three patients will also wait longer than the clinically recommended 90 days for category two elective surgery27 ― procedures like heart valve replacements or coronary artery bypass surgery.28 Waiting times for specialist outpatient appointments (the ‘hidden’ waiting list) are sometimes more than triple the recommended time. These long wait times result in more avoidable emergency department admissions, as patients will often present to the emergency department with non-acute conditions to receive the care that should have been provided through outpatient services, placing an increased an unnecessary burden on emergency departments already struggling to meet community demand.29 It has also been reported that wait times for an appointment with a general practitioner have increased over the last few years,30 and that patients are waiting longer for essential diagnostic tests, such as medical imaging,31,32 which may also result in non-acute patients presenting to the emergency department in an effort to receive more timely care. These access issues create missed opportunities for prevention and early intervention, resulting in patients presenting with more advanced disease and comorbidities that are a direct result of delayed care ― which in some cases requires emergency care ― ultimately making it more challenging and more costly to deliver care. This has a significant human impact (Figure 3).
While governments recognise the pervasive impact of poor health, healthcare in Australia is still viewed as a mere cost rather than a strategic investment, which perpetuates a system that predominantly responds to poor health outcomes rather than actively preventing them. This prevailing paradigm has inadvertently shaped a ‘sickcare’ system rather than a holistic healthcare system that tackles both existing health issues and prioritises prevention. With a population that is growing, ageing, and developing more complex and chronic disease, Australia should be looking at how healthcare expenditure can be maximised to improve health outcomes.
Average life expectancy however is only one measure of health outcomes and is often considered to be a superficial measure as it does not capture factors such as quality of life, disease burden, disability, wellbeing, health inequalities. While Australia has a high life expectancy, it also has a high number of years spent in ill-health compared to other OECD countries, and is lagging compared to other countries when it comes to factors such as prevention of chronic disease and access to timely care.
Figure 3: Patient and healthcare professional stories

The AMA collected stories from patients and healthcare professionals as part of the Clear the Hospital Logjam campaign. Consent was obtained to use these stories. Minor editorial changes were made to stories to remove identifying information.
iAs a member of the OECD, Australia is assessed against the international standards for healthcare quality and performance and compared against other OECD countries.
THE CASE FOR INVESTING IN HEALTHCARE
Government expenditure typically is targeted at public goods ― outputs from which no one can be excluded, and where the use by one does not diminish the availability of the good to others.33When determining what public goods should attract government investment, and the quantum of investment, governments will look at the net public benefit (i.e. the difference between the public benefit and the cost). While there are many measures for public benefit, governments will consider the impact a public good will have on productivity, which in turn has an impact on GDP, fiscal outcomes, and social, health and wellbeing outcomes, as highlighted by the Productivity Commission:
In many cases productivity growth by itself did not directly cause shorter working weeks, more holidays, and longer, healthier lives — some of the beneficial changes that make life generally better today than in the past. But productivity growth did enable those changes, by consistently freeing up small amounts of time and resources year after year, which could subsequently be reallocated to more valuable pursuits. Small changes add up: steady productivity growth has underpinned massive increases in living standards over the longer run.34
While healthcare is not classified public good in the economic sense, it does have high public value.35 Healthcare often leads to positive externalities, as its consumption has a broader benefit to society in addition to the benefit it provides to the individual.36 The challenge with investing in healthcare is that the return on investment is often not a direct financial return, and returns are realised often years or decades after the investment is made.
To combat this issue, economists have developed a range of other economic indicators that can be used to measure intangible outcomes, including:
- Impact on value of a statistical life: an estimate of the value society places on reducing the risk of dying. By convention the life is assumed to be the life of a young adult with at least 40 years of life ahead. It is a ‘statistical’ life because it is not the life of any particular person.37
- Quality-adjusted life years (QALYs): a measure of health outcomes that combines the quantity and quality of life into a single index value. It is based on the assumption that not all years of life are equal in terms of quality, and that the quality of life experienced by an individual should be taken into account when assessing the effectiveness and value of healthcare interventions.38
- Wellbeing-adjusted life years: a measure similar to the concept of QALYs, but also takes into account the individual’s subjective wellbeing or happiness in addition to their physical health status.39
- Disability-adjusted life years (DALYs): a measure of disease burden that combines the impact of premature death and disability in a single metric, calculated by adding the years of life lost due to premature death to the years lived with disability.40
- Health-adjusted life expectancy: also known as years lived in full health, this is a measure of overall health and wellbeing that takes into account both the length of time a person can expect to live and the quality of life they can expect to experience during those years.41
- Years lived in ill-health: a measure that estimates the number of years an individual can expect to live in poor health due to illness or disability. It is a sub-component of the broader measure of DALYs.42
With pressures from rising costs of providing medical care in Australia and increasing demand due to a population that is growing, ageing, and developing more chronic and complex health conditions, it is no surprise governments look to the health budget — an area of large public expenditure — to identify those areas where efficiencies can be gained.
But what if we stopped thinking of healthcare as a cost, and instead viewed it as an investment?
Recognising that traditional macroeconomic indicators (such as GDP) do not present a complete picture of wellbeing and economic outcomes, several countries have developed ways to measure progress, with the OECD Framework for Measuring Well-being and Progress being the inspiration for many countries’ approaches. Using this framework as a foundation as well as lessons from international approaches, Australia is currently developing a Measuring What Matters Statement, which will be the first national framework on wellbeing. This framework will look at a range of indicators alongside traditional measures of economic strength to provide a more comprehensive picture of wellbeing and shape future policy and investment. See AMA’s Submission to the Treasury on the Measuring What Matters Statement for more details.
Investing in healthcare increases economic output
There is now an extensive body of global evidence supporting the concept that investing in healthcare supports economic productivity and growth. The European Union’s Commission on Macroeconomics and Health report The contribution of health to the economy in the European Union was released in 2005 in response to concerns that:
Recent years have seen important advances in our understanding of the link between health and economic development in low-income countries. . . yet this issue has so far received scant attention in rich countries. Is this lack of attention justifiable?43
In the context of Europe’s ageing population, the report presented significant evidence to demonstrate how good health promotes labour supply and productivity, reduces early retirement, and is a key determinant of economic growth and competitiveness. The report concluded:
While the economic argument for investing in health in high-income countries may differ in detail from that in low-income countries, we have found considerable and convincing evidence that significant economic benefits can be achieved by improving health not only in developing, but also in developed countries.44
Workforce participation in Australia
Workforce participation is an important measure of economic activity and plays a crucial role in the economic, social, and human development of a country. When more people are employed, the GDP of a country increases, enabling investment in infrastructure, education, and other social services that can improve the quality of life of its citizens. High workforce participation also promotes social integration and helps to reduce poverty and inequality, and therefore reliance on social welfare.
The Australia’s Future Tax System Review which was commissioned in 2009 by the Commonwealth Government projected that by 2050, 22 per cent of the population would be Australians aged 65 years and older, resulting in a decline in the workers engaged in the labour force.45 Today, workforce participation rates are sitting around 5 per cent higher than what was projected by the 2009 review (Figure 4). The primary reason for this higher participation rate is the sustained and growing engagement of workers aged 55 years and older (Figure 5), which accounts for between 50 and 60 per cent of the higher than predicted participation rate. This is likely due to a combination of factors, including older Australians remaining healthier for longer as well as policies that encourage older workers to stay in the workforce (such as minimum ages to access superannuation). The remaining 40 to 50 per cent is likely due to increased participation of females and lower unemployment rates, demonstrating the effectiveness of labour policies such as the Higher Education Loan Program (HELP), parental leave, and subsidies for childcare.
Figure 4: Ratio of workers to working population for different ages compared to projectedii ratio, 1978 to 202246,47,48
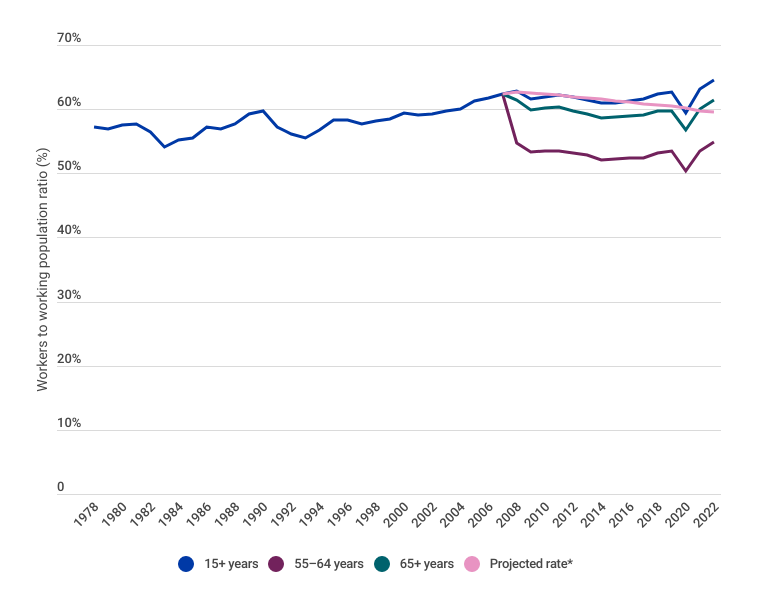
iiProjected by the 2009 Australia’s Future Tax System Review
Figure 5: Proportion of workers age 55–64 and 65+ years in the working population, 1978 to 202249
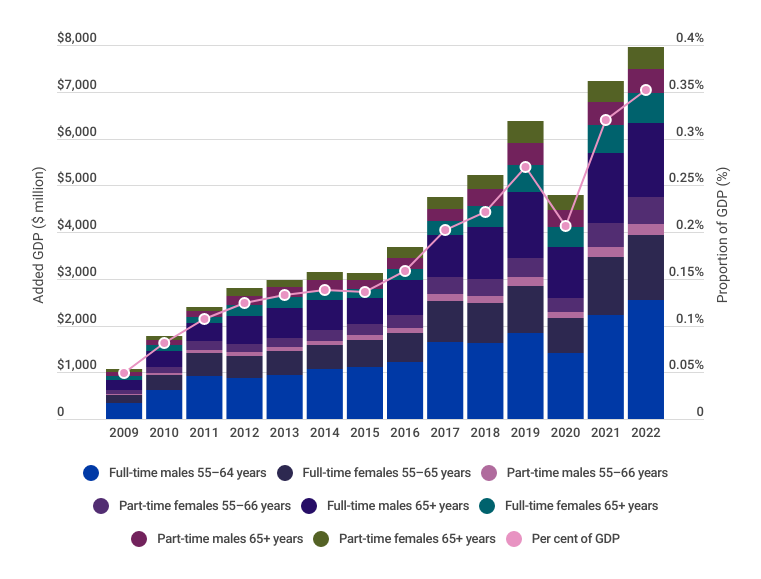
Depicted in Figure 6, AMA analysis indicates that increased participation of workers aged 55 and over has resulted in an estimated 2.5 per cent increase in GDP ($57.3 billion) from 2009 to 2022 (i.e. the years following the 2009 review). Other benefits to the economy include less people drawing on the Commonwealth Government’s Age Pension or requiring aged care services — an estimated fiscal saving of 1–2 per of GDP (cumulative $20.9 billion to $41.8 billion). This has allowed governments to reallocate funds to other important productivity boosting measures such as education, parental leave, and childcare, as well as delay increases to taxation.50,51,52,53
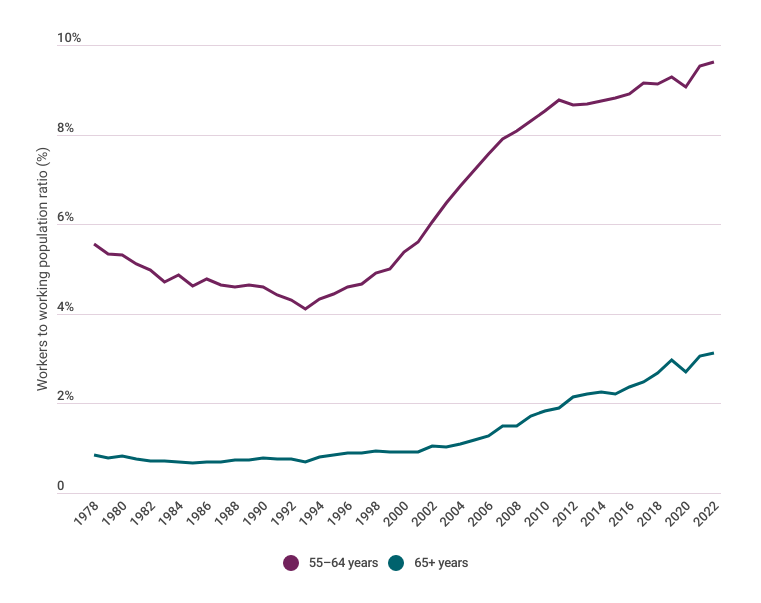
Figure 6: Impact of increased participation of workers age 55–64 and 65+ years on GDP, 2009 to 202254,55,56,57
Impact of the COVID-19 pandemic on workforce participation
The COVID-19 pandemic had a profound impact on workforce participation globally, leading to a reduction in workforce participation as a result of widespread job losses, business closures, and deaths. In Australia, the labour market was assisted by monetary, fiscal, and health policy, creating an environment that fostered economic growth, as well as relatively low hospital admissions and deaths compared to many other countries. These strong labour policies and public health measures resulted in only a minor drop in workforce participation of approximately six per cent, which subsequently increased to above pre-pandemic levels after COVID-19 restrictions were removed (Figure 7). This increase is largely due to continued participation of those aged 55 years and older.
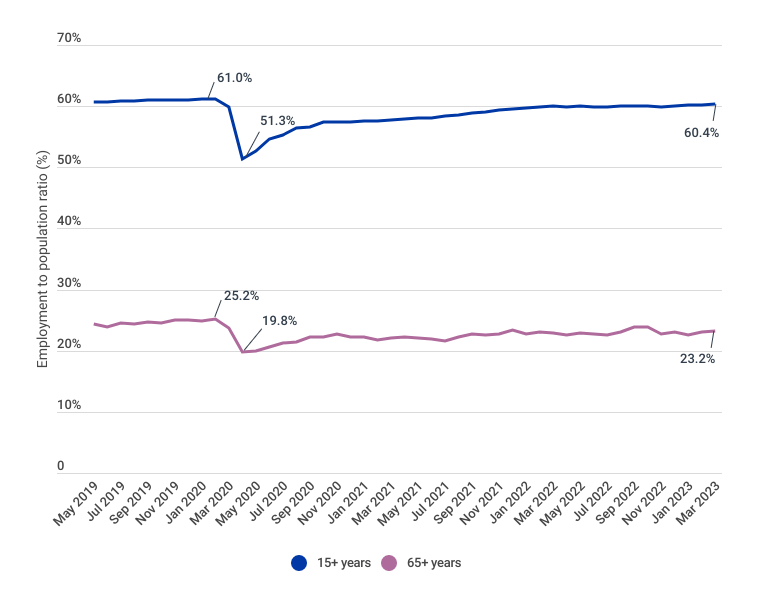
As a comparison, the United States of America (USA)iii also had strong employment growth during 2021 and 2022, however suffered a more significant drop in workforce participation of approximately 10 per cent during the COVID-19 pandemic (Figure 8). Unlike Australia however, workforce participation in the USA has not recovered to pre-pandemic levels, largely because people aged 65 years and older have not re-entered the workforce. This is consistent with previous economic downturns and will likely impact the USA’s future economic activity and output for several years.
Figure 7: Australian employment to population ratios for 15+ years and 65+ years, May 2019 to March 202358
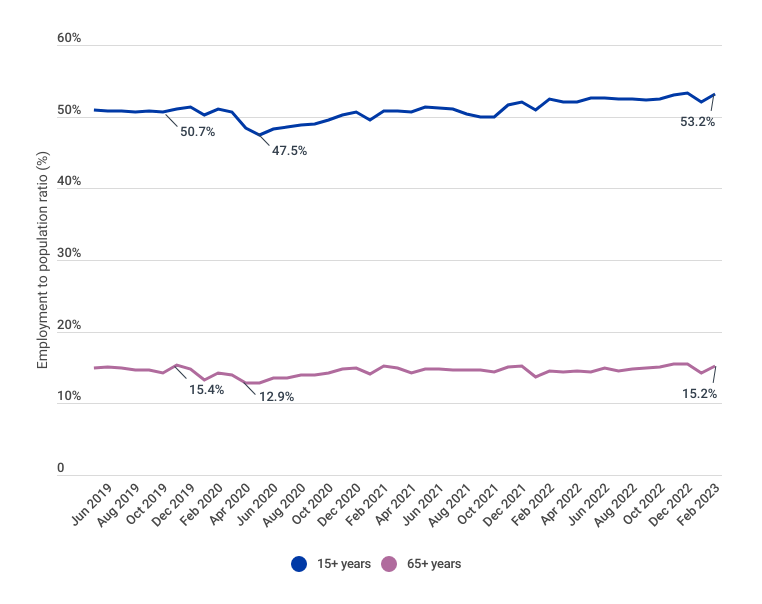
Figure 8: United States of America employment to population ratios 15+ years and 65+ years, June 2019 to February 202359
As the Australian population continues to age over the next two decades, the ability for Australia to maintain this higher workforce participation will be challenging without effective policies that keep people in the workforce. While governments can continue tweaking existing levers, it is likely that other mechanisms will be needed to continue this positive trend. There is an opportunity to look at investing in healthcare through a similar lens as investing in labour policies, as driving better health outcomes ultimately improves economic outcomes.
Preparing for a future pandemic
The COVID-19 pandemic shock has highlighted significant limitations in the capacity of Australia’s healthcare system to respond to a surge in demand. Despite having one of the most well-resourced healthcare systems globally, Australia was not adequately prepared for the scale and complexity of the COVID-19 pandemic. In particular, public hospitals were struggling to meet demand before the pandemic largely due to workforce and hospital bed shortages.60 The increased demand created by the COVID-19 pandemic led to delays in elective surgery and outpatient appointments as public hospitals were not equipped with consumables, medical equipment, and appropriate personal protective equipment and protocols, and had limited capacity to scale up and meet increased demand created by the pandemic.
As access to hospitals and other healthcare settings was limited during the pandemic, much of the demand fell onto general practices. General practices had to adapt rapidly to the change in circumstances with many practices transitioning to telehealth appointments, implementing unfamiliar infection control measures, and preparing to deliver thousands of COVID-19 vaccines. Pre-existing shortages of general practitioners meant that general practices faced several challenges meeting the increased demand, with many practices needing to increase their opening hours. Adding more hours per general practitioner, however, was not sustainable particularly as underinvestment in general practice by successive governments has put a significant strain on practices.
Three years on from the onset of the pandemic, many general practices struggle to remain viable, public hospitals are operating at or over capacity, the nation is facing unprecedented workforce shortages, and there is a major backlog in elective care. Much of Australia’s pandemic response relied on the goodwill of healthcare workers ― a group who went above and beyond normal expectations to keep Australia safe ― which has led to a surge in healthcare worker burnout. Additionally, the COVID-19 pandemic is still impacting communities, and we are only beginning to understand the implications of long COVID.
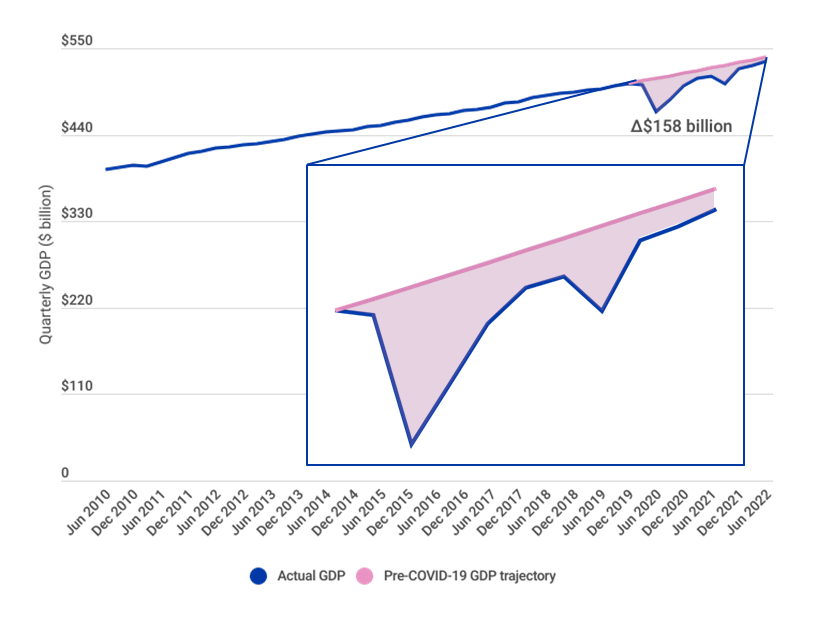
If another pandemic or similar event was to occur in the next few years, Australia would likely be in a worse position than before the COVID-19 pandemic as there is even less capacity in the system now. With the pandemic costing Australia an estimated $158 billion just in GDP loss (Figure 9), another pandemic or sudden increase in demand for healthcare in the next few years would have an even bigger short-term impact on Australia’s economy, and potentially a greater lasting impact on GDP loss. Despite this risk, Australia is not prioritising investment in capacity expansion to prepare for future events that could increase demand for healthcare services. Additionally, the absence of a dedicated national government agency to drive health workforce planning may be a contributor to the current workforce shortages. For example, Health Workforce Australia ― the Commonwealth statutory authority that delivered a national, coordinated approach to health workforce planning and reform ― was abolished in 201461 and has not been replaced by a similar independent national agency.
Figure 9: Australian GDP actual and pre-COVID-19 trajectory, June 2010 to June 202262
Investing in healthcare improves lives
It is widely acknowledged that investment in healthcare improves health outcomes, life expectancy, and quality of life. Australia has made significant gains in life expectancy over the last century, largely due to investment in healthcare as well as social determinants of health. Since 1890, life expectancy in Australia has increased for females from 50.8 years to 85.4 years (34.6 years) and for males from 47.2 years to 81.3 years (34.1 years). Over the past 50 years, life expectancy at birth has improved for females by 10.9 years and males 13.5 years, meaning people born in 1972 have a longer life expectancy than was expected when they were born.63
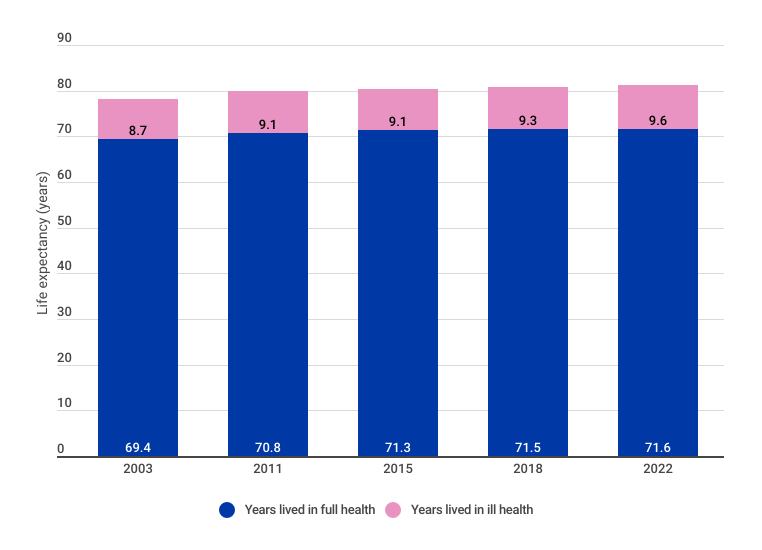
While this significant improvement in life expectancy is positive, the number of years lived in ill-health has also increased over time for both males
(Figure 10) and females (Figure 11). Additionally, it is important to acknowledge that health outcomes are not uniform across the Australian population, with many diverse groups ― including lower socioeconomic groups,64 Aboriginal and Torres Strait Islander peoples,65culturally and linguistically diverse groups,66 LGBTQIA+,67 and Australians living in rural and remote locations68 ― experiencing significant health inequities. For example, the mortality rate in 2020 from all causes of death for people living in the lowest socioeconomic quintile was 589 deaths per 100,000 population, compared to 390 deaths per 100,000 population for people living in the highest socioeconomic areas. Furthermore, people living in the lowest socioeconomic areas are 2.2 times as likely to die from potentially avoidable causes than those in the highest socioeconomic areas.69 Further outlined in the AMA’s Position on Social Determinants of Health, these inequities typically arise because of inequalities within society, and can be associated with forms of disadvantage such as poverty, discrimination, and access to foods and services.
Figure 10: Australian male life expectancy and health, 2003 to 202270
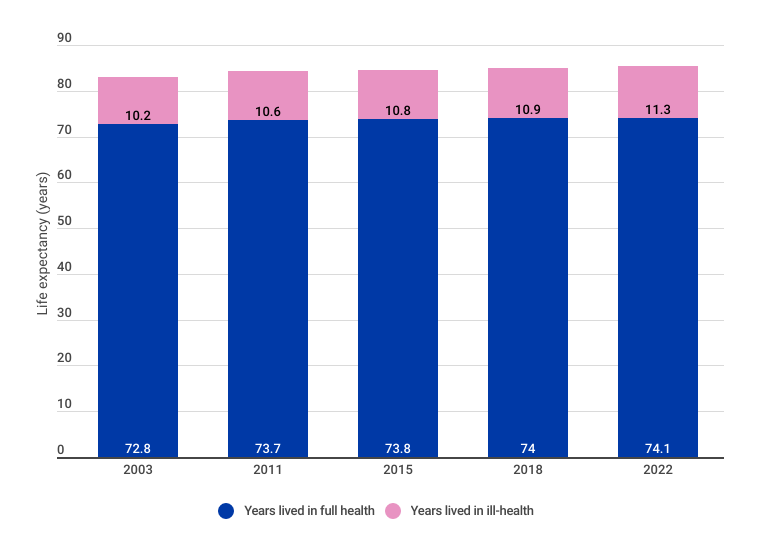
Figure 11: Australian female life expectancy and health, 2003 to 202271
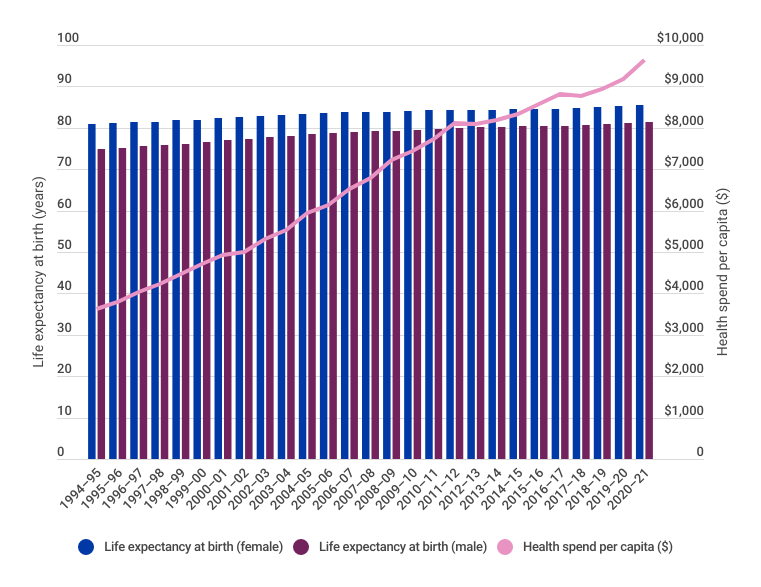
Depicted in Figure 12, we are now at a point where the investment required to increase life expectancy will be more challenging as healthcare pushes up against the technology frontier. Future investment in healthcare should therefore focus on two outcomes:
- improving the life expectancy of more of the population, especially diverse populations who experience health inequity and disparity, by improving access to healthcare services
- reducing the number of years lived in ill-health (i.e. reducing DALYs) by investing in prevention and early intervention.
Improving the life expectancy of diverse populations as well as reducing the number of years lived in ill-health will have direct measurable economic benefits from increased workforce participation, as well as other valuable but intangible inputs into the economy (such as the social benefits of community service and volunteering).
Figure 12: Health spending per capita (2023 dollars) compared to life expectancy at birth for males and females, 1994–95 to 2020–2172,73,74
Investing in healthcare saves money
It is widely acknowledged by economic leaders with a health focus, including the World Health Organization,75 the OECD,76 and the World Economic Forum,77 that investing in healthcare — including prevention and early intervention, new technologies, and new models of care — saves money, as prevention of illness and disease and increased system efficiency reduces healthcare costs in the long term. As an example, the Productivity Commission’s Shifting the Dial: 5 Year Productivity Review, published in 2017, looked at a range of factors that impact productivity in Australia’s economy. With respect to healthcare, the Productivity Commission proposed several recommendations to create structures that are integrated, patient-centred, and promote efficient prevention and chronic illness management. The Productivity Commission estimated that these reforms could save the healthcare system $140 billion over 20 years.78
The AMA Vision for Australia’s Health provides a blueprint for healthcare system reform across five pillars: general practice, public hospitals, private health, a health system for all, and a health system for the future. This section provides examples how investing in healthcare saves money across each of the five pillars.
Note: this section draws on findings from previous AMA research as well as new analysis performed by the AMA. Where a previous AMA report is referenced, further details, including methodology and references, can be found in the original research report. Where new analysis has been performed, methodology and references are detailed in the reference section of this report.
 |
| General practice is the cornerstone of successful primary healthcare, and is key to ensuring we have a high-quality, equitable, and sustainable healthcare system. A well-funded and resourced general practice sector is pivotal to improving the health outcomes of individuals and communities, and can create significant savings through better care, greater efficiency, and reducing the burden on other more expensive parts of the healthcare system.79 |
Funding chronic wound care in general practice
It is widely acknowledged that chronic wounds represent a significant health and economic burden in Australia. It is estimated that approximately 450,000 Australians currently live with a chronic wound, costing the healthcare system around $3 billion a year.
The AMA estimates that the cost of hospital admissions due to chronic wounds in 2019–20 alone was $352 million, with procedures performed on chronic wounds costing $115.7 million. With a growing burden of chronic disease in the community, in particular type 2 diabetes, hospital admissions for chronic wounds have been increasing each year, particularly amongst younger cohorts.
The AMA estimates that funding evidence-based wound care in general practice, including wound-specific MBS items for general practitioners and practice nurses and a funded wound consumables scheme for a limited range of specific conditions could cost as little as $23.4 million from 2022–23 to 2025–26. It should be noted that this does not include the cost of education and training for healthcare professionals, which is essential to the delivery of evidence-based wound care.
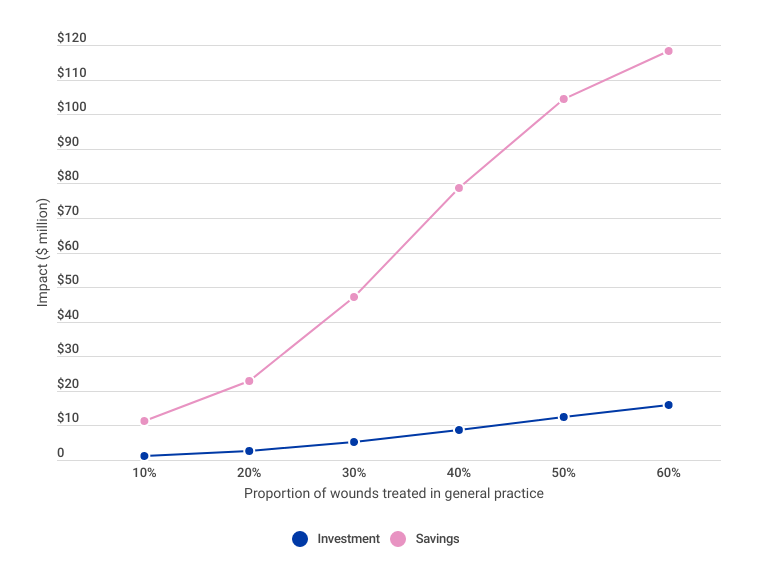
As the AMA’s modelling indicates that receiving care through the general practice is cheaper than receiving care through hospital outpatient clinics or other community healthcare settings, it is estimated that an investment of $23.4 million in the delivery of evidence-based wound care will save the healthcare system $203.4 million over four years. This is a return of $8.68 for every $1.00 invested in delivering evidence-based wound care. Additionally, the proposed new MBS items are estimated to free up around 148,000 general practitioner consultations in the first year, and 162,000 consultations by the fourth year, as under the current consultation structure a general practitioner is required to be present on all occasions to bill the MBS. As the program continues to expand, it is expected that more patients will receive wound care in general practice, and the amount saved annually would continue to increase as the proportion of wounds treated by general practice increases, depicted in Figure 13.
The Commonwealth Government announced $47.8 million over five years from 2022–23 in the 2023–24 federal budget to improve the treatment of certain chronic wounds through the establishment of a wound consumables scheme, as well as education and training for healthcare professionals on chronic wound management.80 The scheme will be available for people with diabetes aged 65 years and over, and for Aboriginal and Torres Strait Islander peoples with diabetes age 50 years and over.
See Solutions to the chronic wound problem in Australia for more details.
Figure 13: Annual Australian proportion of wounds treated in general practice costs and savings
Addressing avoidable hospitalisations for residential aged care residents and older people in the community
Older Australians are often hospitalised for conditions that could be managed in general practice, such as some injuries, skin disorders, and urinary tract infections. The AMA estimates that:
- around 159,700 patient days annually are due to preventable hospital admissions from residential aged care facilities, costing an estimated $1.43 billion over four years
- non-admitted emergency department presentations (49,300 annually) by residential aged care residents are costing an estimated $497 million over four years
- around 18,800 re-presentations annually (residents who present to the emergency department within 30 days of an overnight hospital stay) are estimated to cost least $138 million over four years (due to transport of patient)
- 232,000 patient days are associated with people waiting in hospital for a place in an aged care facility, at a cost of $887 million over four years
- an estimated 1.9 million patient days per year are associated with preventable hospital admissions from people aged 65 years and over in the community, costing $18.2 billion over four years.
The AMA estimates that better investment in primary care in the community and aged care would save around $21.2 billion over four years from preventing avoidable hospital admissions in the community for Australians over 65 years and aged care residents.
See Putting health care back into aged care for more details.
|
| The provision of timely elective and emergency treatment in public healthcare systems is crucial in ensuring patients receive the care they need while minimising costs for both patients and the healthcare system. Investing in timely treatment can prevent the need for more costly medical interventions, as patients are less likely to develop complications or other associated health conditions that may require more expensive surgeries, extended hospital stays, or readmissions to hospital. Additionally, investing in hospital programs that support the timely discharge of patients from hospitals or provide out-of-hospital care can generate savings as well as reduce the burden on hospitals.81 |
Addressing public hospital exit block
‘Exit block’ is a term commonly used to describe the situation when patients receiving hospital inpatient care are medically able to be discharged but have no safe destination. The most common reasons for this are that people’s care needs have changed during their hospital admission, and they are now waiting for appropriate aged care (such as a place in a residential aged care facility or a home care package at the right level), or for disability care (often related to National Disability Insurance Scheme (NDIS) funding).
Exit block is a symptom of a healthcare system that is struggling to meet community demand for health and social services, however it has a significant impact on hospital logjams. Exit block means there are less beds for inpatient services, which ultimately results in increased waiting times for ambulance services, emergency department services, and essential elective surgeries.
The AMA is calling on governments to work together to refine current arrangements for transitioning people out of inpatient wards into appropriate care and implement targeted solutions to address exit block. AMA analysis reveals that addressing exit block could save an estimated $811.6 million to $2.17 billion a year.
See Hospital exit block: A symptom of a sick health system for more details.
Expanding public hospital capacity
There are an estimated 643,000 people waiting for planned surgery in public hospitals, with approximately half of these people waiting for an outpatient appointment with a specialist, to then be added to the waiting list (referred to as the ‘elective surgery hidden waiting list’).82 Additionally, approximately 8,600 people are added to the waiting list each year.83 The AMA estimates that clearing the current waiting list will cost the Commonwealth and state and territory governments a combined $4.4 billion.84
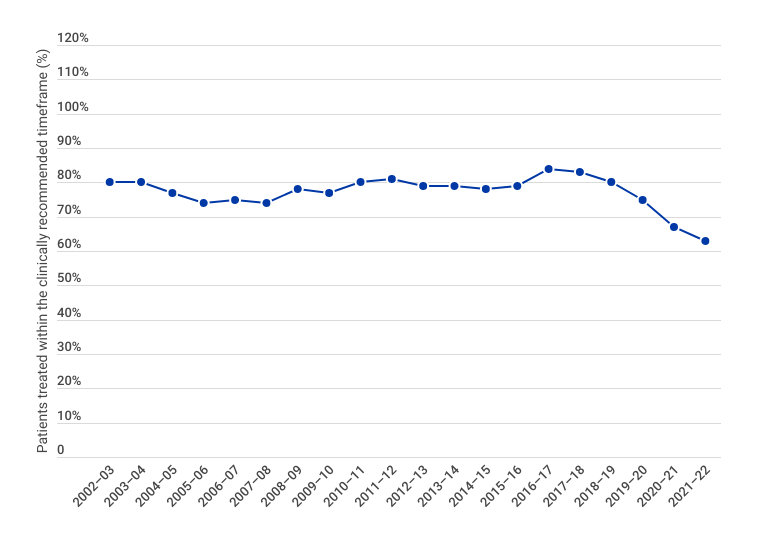
In 2020–21, 778,000 planned elective surgeries were performed in public hospitals, however a large proportion of these surgeries were not completed within the clinically recommended timeframes.85 During the 2021–22 reporting period, more than one in three patients (37 per cent) waited longer than the clinically indicated 90 days for Category 2 planned elective surgery, with the proportion of patients treated within the clinically recommended time decreasing year on year from 2016–17 (Figure 14). As of March 2023, patients on the elective surgery waiting list were spending more than a million days waiting longer than the clinically recommended timeframe, which is an average of 184 days (26 weeks) per person, with 6.3 per cent of patients waiting more than a year.86,87,88,89,90,91,92,93,94,95,96
Figure 14: Proportion of Category 2 planned elective surgery patients admitted within the clinically recommended timeframe (90 days) nationally, 2002–03 to 2021–2297,98
These patients are often waiting in pain, with research suggesting that up to 30 per cent of patients are unable to work.99,100 Many are also unable to engage socially and contribute to their communities in other ways, such as volunteering and community service.
Assuming a conservative 20 per cent of patients on the waiting list are not able to work for the average waiting time, the AMA estimates that the cost to the economy of lost wages is approximately $4.6 billion per year.101 This does not include the costs related to personal pain and stress for both the patient and their loved ones, the costs associated with caring for the patient while they are waiting for surgery (i.e. pain management, medical appointments etc.), or the costs associated with reduced social and community engagement. Therefore, the cost of the elective surgery backlog is more than what it would cost to address it.
The Australian health and hospital system clearly has a systematic lack of capacity that has resulted in an extensive waiting list as well as consistent underperformance of public hospitals across Australia year-on-year. Studies show that hospitals should be operating at around 80–85 per cent occupancy rate (i.e. the whole system should be designed with at least 15–20 per cent more capacity than technically estimated).102,103,104 This reserve capacity allows hospitals to manage fluctuations in demand and minimises the risk of delaying or denying admissions. Allowing for added capacity is also essential for minimising the risk of clinical errors, burn out, and mental health issues associated with working extended hours.
Between 2011–12 and 2019–20 (excluding 2020–21 due to COVID-19 impacts) the system was operating with a capacity shortfall of between 22–32 per cent.105 Noting that hospitals should be operating at 20 per cent reserve capacity, we therefore need 42–52 per cent more capacity in our hospitals to meet community demand in a safe and sustainable way. This does not include the impact of the increasing volume and acuity of emergency department presentations on elective surgery waitlists, which would also need to be addressed through prevention and early intervention.
See Public hospitals: cycle of crisis for more details.
|
|
Private healthcare is an essential pillar of our healthcare system, working in partnership with the public sector to ensure Australians have access to safe, high-quality, and affordable private healthcare. Demographics, chronic disease, and technology are all changing rapidly, and as such the way we deliver healthcare must also change accordingly. Having cleared the first hurdles for telehealth and home-based hospital care, we need to develop them further as part of a deliberate design of a better system — a system that provides innovative programs which are patient-centred, cost effective, led by medical practitioners, and insurer funded. |
Investing in out-of-hospital models of care
Rates of knee replacements in Australia (as well as other countries)106 have been rising each year since 2003, with an increase of 174 per cent in the private sector and 67.3 per cent in the public sector between 2003 and 2021.107 In 2021, 77.2 per cent of all knee replacement procedures reported were undertaken in private hospitals.108 For total knee replacements specifically (also referred to as total knee arthroplasty), 59,474 were reported in 2021, of which 45,353 were performed in the private sector.109
Total knee and hip replacements are the biggest cost to the healthcare system of all medical procedures, largely due to volume.110 A significant portion of this cost is postoperative inpatient rehabilitation.111,112 Naylor et al. (2017) reported that two large private insurers in Australia had indicated the cost of inpatient rehabilitation to be $8,400 ($700/night for 12 nights at 2015 dollars).113 This estimate aligned with their findings, which revealed a median cost of $9,978 ($7,599–11,841) for inpatient rehabilitation (2014–15 dollars).114 It is estimated that the duration of inpatient rehabilitation following a total knee replacement is around 10 days.115,116
Studies show that, for clinically eligible patients, rehabilitation in the home can produce comparable recovery outcomes to inpatient rehabilitation,117,118 often at a lower cost.119 While studies on the proportion of clinically eligible patients in the private sector are limited, consultation with industry experts in 2022–23 indicates that 70–80 per cent are eligible. This is consistent with an estimate for knee replacement (not specifically total knee replacement) of 79 per cent of patients being clinically eligible.120With an estimated 60 per cent of private patients currently receiving out-of-hospital rehabilitation for total knee replacements, this represents a missed opportunity of 10–20 per cent.
Naylor et al. (2017) estimated the median cost of rehabilitation in the home to be $374 (2014–15 dollars),121 an estimated difference of $9,604 ($11,354 if adjusted to 2022 dollars). Studies also suggest that rehabilitation in the home is often more convenient and comfortable for patients, as it allows recovery in a familiar environment.122,123 While the duration of inpatient rehabilitation ― and therefore the cost difference between inpatient and in the home rehabilitation ― will vary depending on the patient’s specific circumstances and care requirements, consultation with industry experts in 2022–23 supports a duration of 10 days for inpatient care and a cost difference of around $11,000 (2022 dollars).
These potential savings would enable insurers to lower private health insurance premiums, which could result in savings for government from reduced premium rebates, and increased uptake of private health insurance due to improved value proposition (which in turn, would lower premiums further as part of a positive feedback loop). The positive economic impact could also extend beyond this, as patients may be able work from home or resume caring responsibilities.
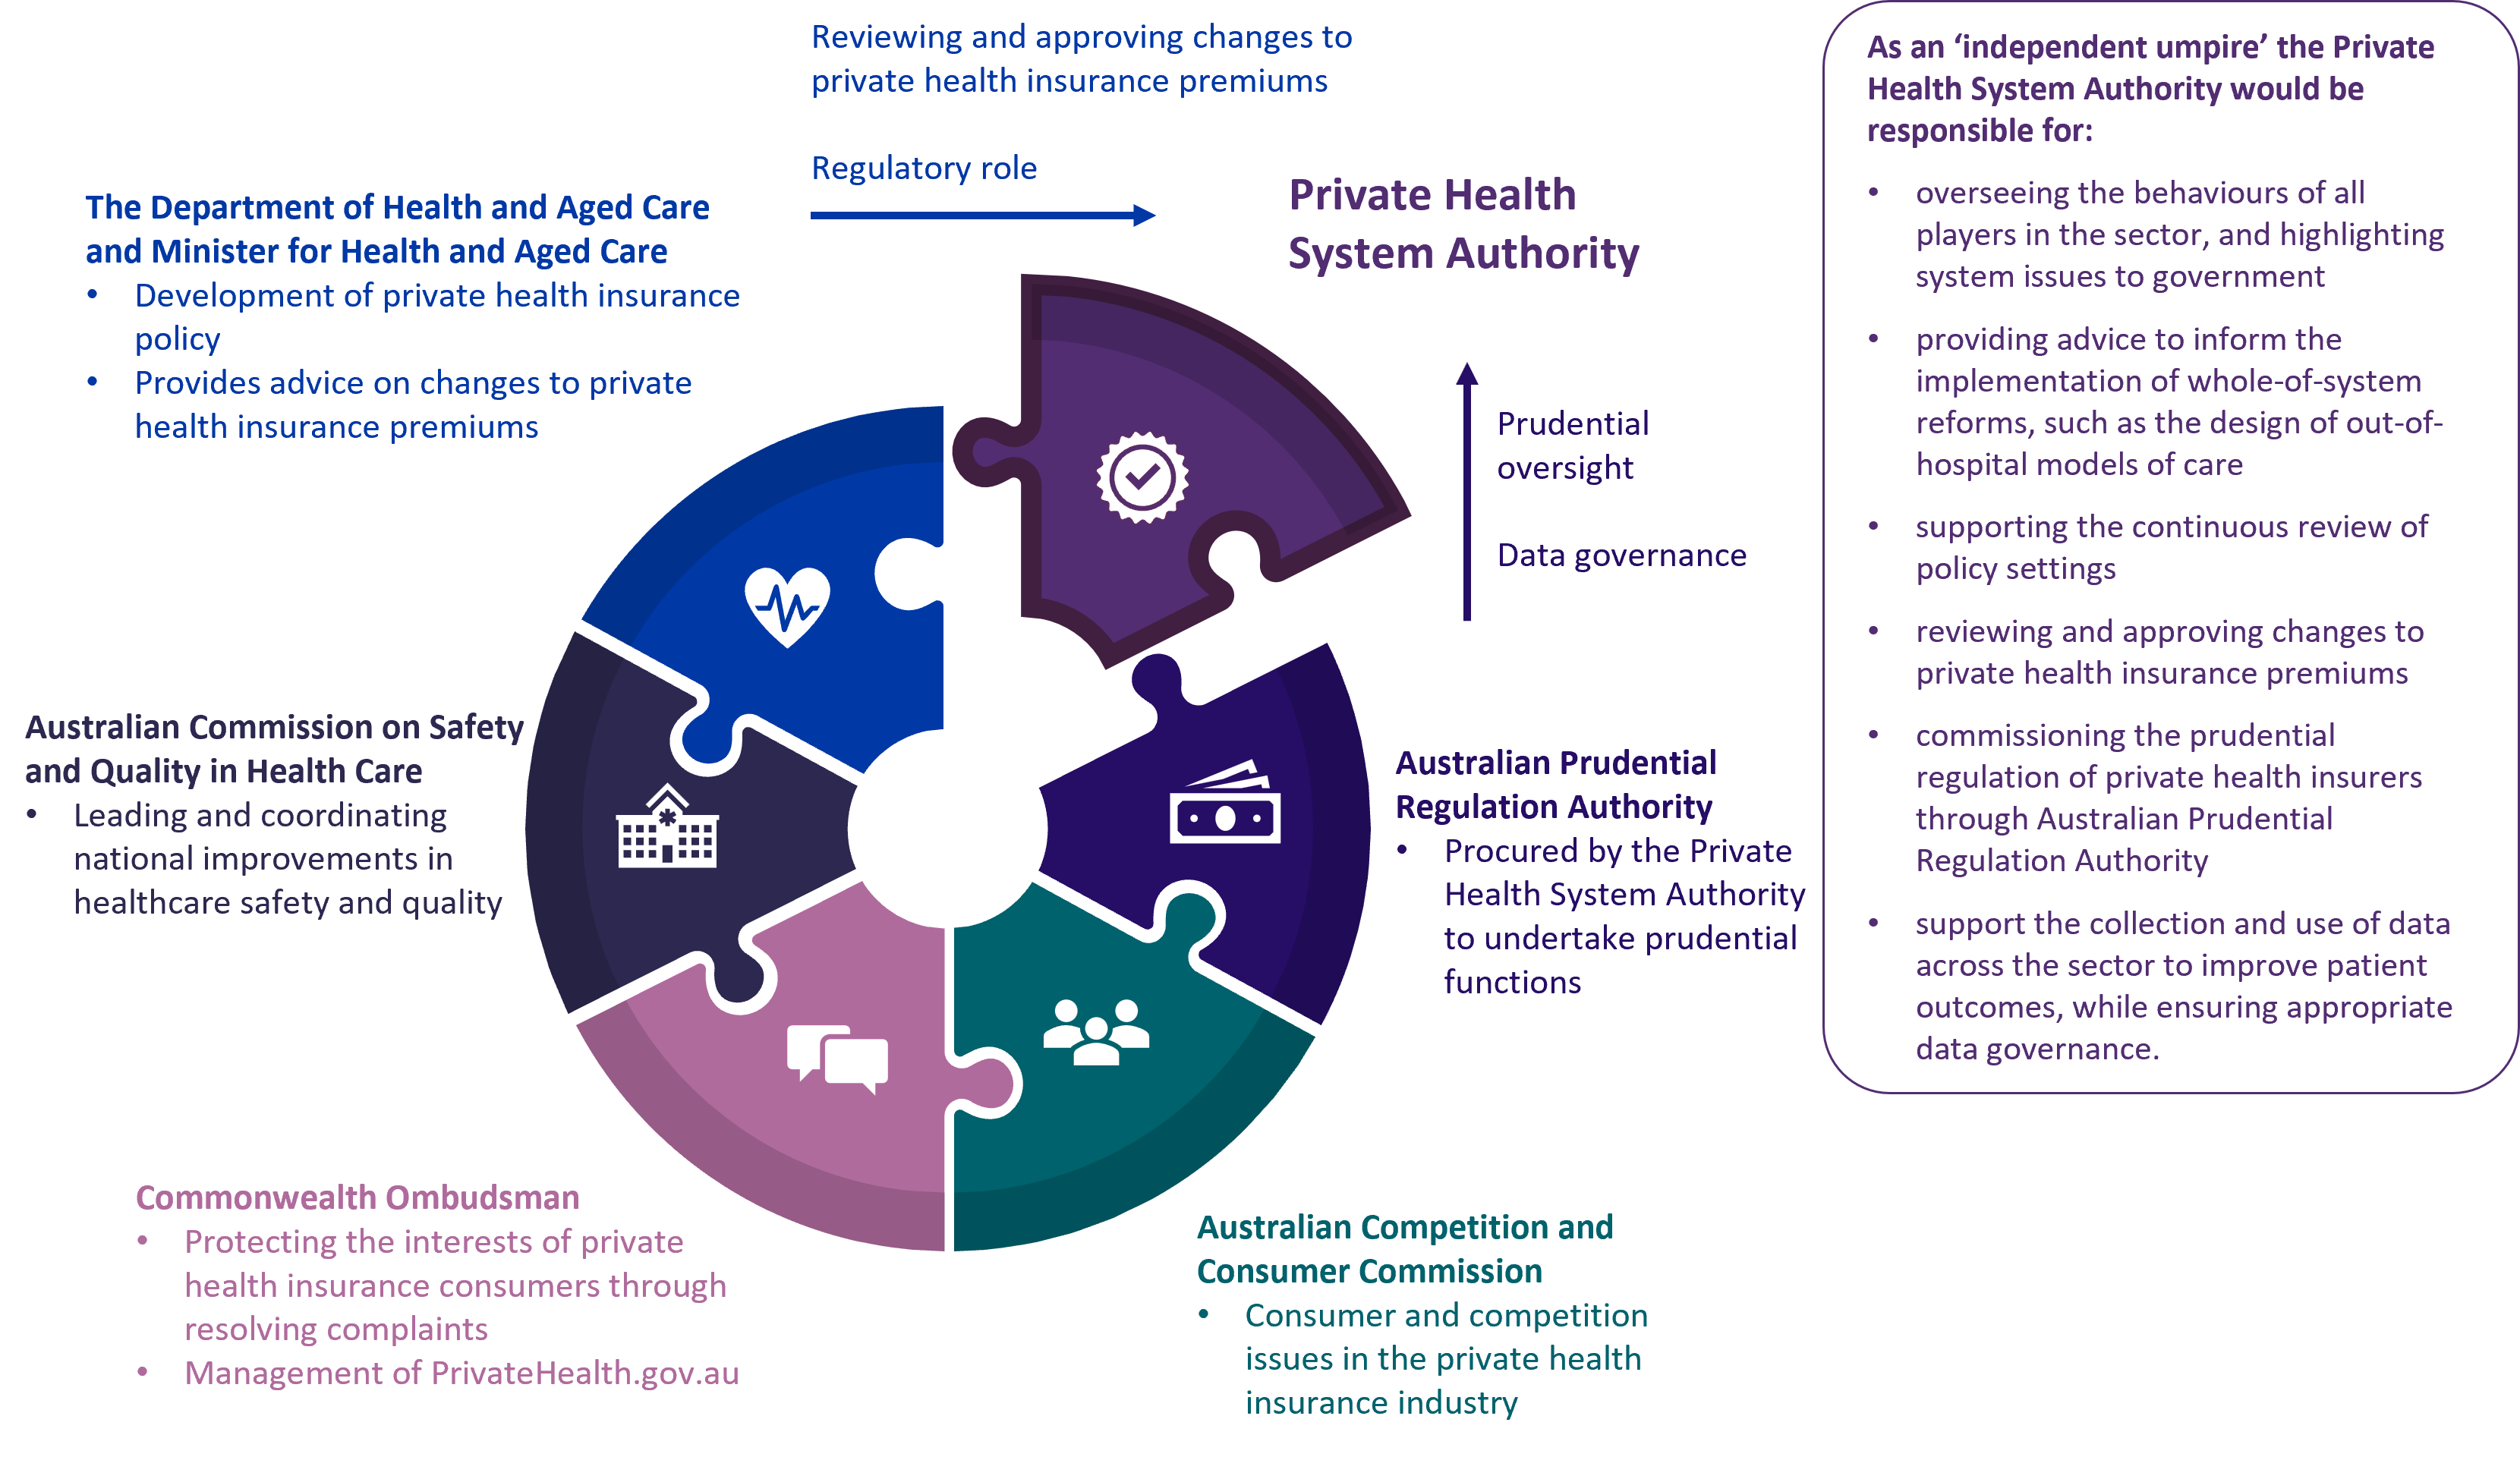
Despite the potential for significant savings, there is no one driving the conscious design of these private out-of-hospital models of care in a holistic, efficient, and consistent way across the whole private healthcare system, with patient protections in place irrespective of insurer, hospital, or location. There is also no one ensuring that the transition to increased out-of-hospital care will not adversely impact the long-term viability and sustainability of the private healthcare system. The AMA is calling for the establishment of an independent Private Health System Authority (Figure 15) to bring the private health sector together and create a platform for reform, including the conscious design of private out-of-hospital models of care that provide protections for patients and consistency across the market, while unlocking a wave of productivity and cost savings. At an estimated net cost of $10 million over four years, the establishment of this independent authority represents a small investment for a large return.
See A whole of system approach to reforming private healthcare for more details on the Private Health System Authority.
Figure 15: The role of the Private Health System Authority in the current regulatory environment
 |
|
Public health encompasses a broad range of measures that aim to prevent disease, promote health, and prolong life. Investing in public health measures such as disease surveillance, vaccination programs, and health promotion, can have a significant impact on reducing healthcare costs and improving health outcomes. Public health initiatives also aim to address health and social inequalities and ensure that everyone has access to healthcare and social determinants of health, regardless of their socioeconomic status, Indigenous status, or geographic location. For public health measures to be successful, they must encourage the population to take preventative actions to improve their own health outcomes. |
A tax on sugar-sweetened beverages
When a tax on food or drink is introduced, it sends a signal that the product is unhealthy while also creating a disincentive to purchasing it. It also encourages manufactures to reformulate their products. The AMA has modelled the impact of an excise tax on select sugar-sweetened beverages based on sugar content, set at $0.40 per 100 grams of sugar (per unit of product). This aligns with the World Health Organization’s recommendation that a tax on sugar-sweetened beverages would need to raise the retail price by at least 20 per cent in order to have a meaningful health effect. Under the proposed tax rate, the amount of tax paid on a 375 mL can of soft drink with 40 grams of sugar (sugar content of 10.6 grams per 100mL) would be $0.16.
Modelling indicates that a tax on select sugar-sweetened beverages would reduce consumption by 12 to 18 per cent, which is 27,596 to 43,804 tonnes of sugar, and raise annual government revenue of $814 million to $749 million. Previous Australian modelling estimated that a tax on sugar-sweetened beverages would result in a 12.6 per cent decrease in sugar-sweetened beverage consumption, resulting in a decline in the prevalence of obesity of 2.7 per cent in men and 1.2 per cent in women. After 25 years, it was estimated that the tax would result in 16,000 fewer cases of type 2 diabetes, 4,400 fewer cases of heart disease, and 1,100 fewer persons living with the consequences of stroke. Health expenditure savings would total $609 million to $1.73 billion.
See A tax on sugar-sweetened beverages: What the modelling shows for more details.
 |
|
Creating a healthcare system that is ready for the future will require the sector to think outside the box when it comes to how and where healthcare is provided. To achieve this, we will need to build on the learnings from the COVID-19 pandemic and embrace new technology to improve and inform healthcare delivery. We will also need to build a system that promotes stewardship of healthcare resources to ensure patients continue to receive the best quality care, now and into the future (see AMA Position Statement on Doctors’ Role in Stewardship of Health Care Resources for more details). This will help prepare Australia’s healthcare system to respond to current and future threats, such as pandemics, workforce shortages, an ageing population, increased chronic disease, climate change, and antimicrobial resistance. |
Consolidating and building on reforms to telehealth gained during the COVID-19 pandemic
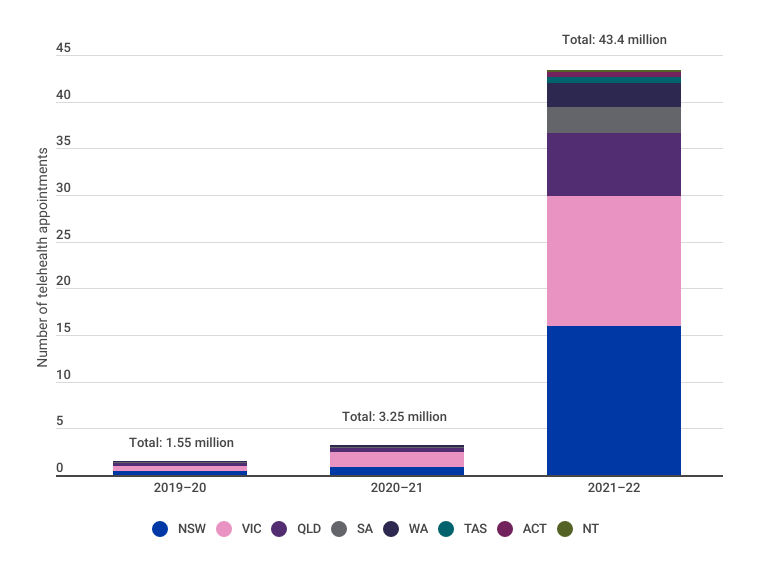
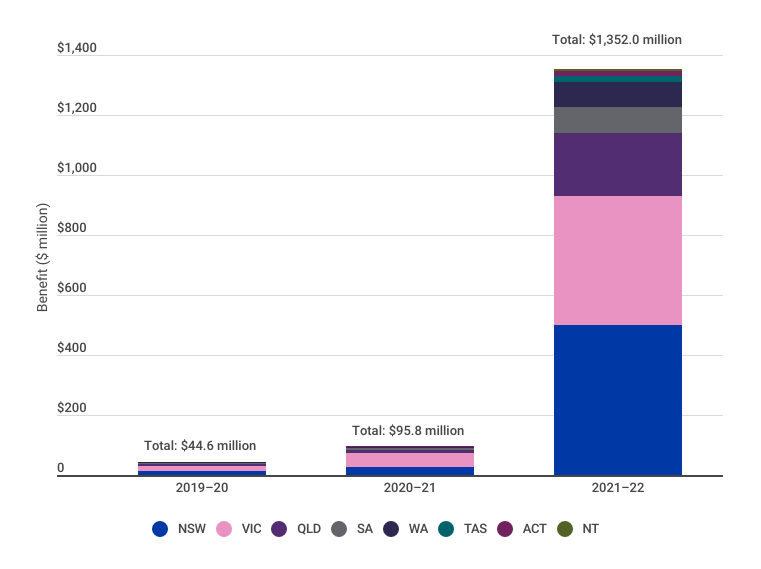
Embracing new technology and innovation can lead to significant cost savings in the long run, as it improves the efficiency of healthcare services, reduces errors, increases productivity, and provides more targeted and effective treatments. During the COVID-19 pandemic ― a period of high demand for healthcare ― we saw a shift from face-to-face appointments to telehealth appointments, with general practice appointments via telehealth growing from approximately 1.5 million to over 43 million per year (Figure 16).
Figure 16: National number of telehealth GP appointments by region, 2019–20 to 2021–22124
While telehealth is not a substitute for face-to-face care, it does have several economic benefits for both healthcare professionals and patients:
- healthcare professionals are often able to see more patients when appointments are conducted via telehealth
- it reduces the risk of disease transmission, as both healthcare professionals and patients are protected from other unwell patients
- patients do not need to travel to receive healthcare, which is particularly beneficial for those who need to travel long distances to access healthcare.
Depicted in Figure 17, the estimated benefit of telehealth in 2021–22 was $1.35 billion (around $31.16 per appointment).
Figure 17: Estimate of national benefits from reduced travel due to GP telehealth125,126
ivThe benefit includes travel time saving, fuel saving, tyres saving, vehicle depreciation, reduced crashes, and environmental savings.
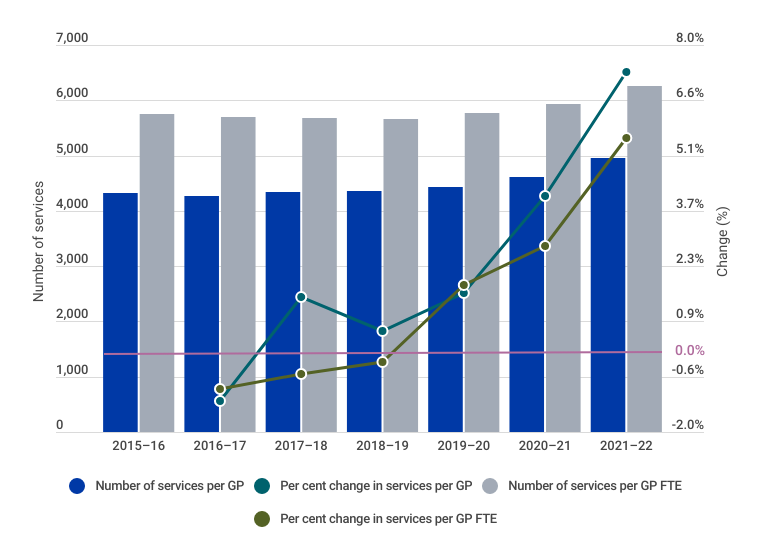
In the last few years, we have seen more services delivered per general practitioner, with telehealth likely one of the key enablers of this increase in productivity (Figure 18).
Figure 18: National number and per cent change of services per GP per year 2015–16 to 2021–22127
There is an opportunity to consolidate and build on the reforms undertaken during the COVID-19 pandemic with respect to how healthcare is delivered and further integrate telehealth into the delivery of safe and high-quality care, without detracting from face-to-face medicine. Telemedicine could include:
- improved incorporation of telehealth into aged care to ensure aged care residents have timely access to healthcare, reducing the need to be transferred to hospital
- incorporation of remote monitoring technology, such as medical wearables to support monitoring of patients outside of healthcare settings
- the use of remote monitoring technology to support prevention and early intervention.
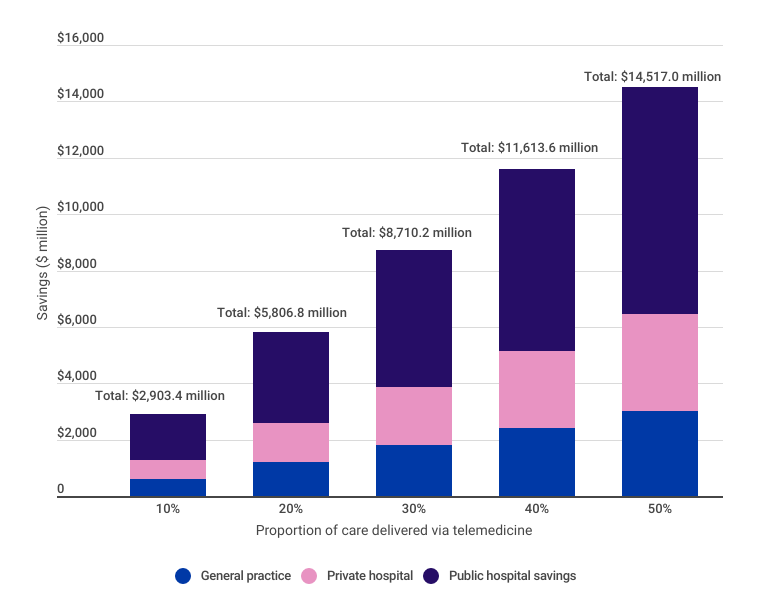
Financial, fiscal, and economic savings could be significant depending on the proportion of patients that are able to access telemedicine. While telemedicine does not replace face-to-face medicine and not all health services can be provided in this way, there are significant gains to be made where these alternative options are suitable. A strategic view of the range of possible savings if different parts of the healthcare system continue to adopt telemedicine is outlined in Figure 19.
Figure 19: Annual potential savings from expansion of telemedicine128
SHIFTING FROM A SICKCARE TO A HEALTHCARE SYSTEM
The COVID-19 pandemic had an unprecedented and profound impact on health in Australia. It put health at the forefront of decision making, and showed us that without good health, we cannot function as individuals or as a society. It also caused a dramatic and permanent shift in how, when, and where healthcare is delivered, and how remarkable things can be achieved when governments, healthcare professionals, and communities work together.
Importantly, the pandemic exposed significant shortcomings in our system that were present well before the pandemic. Australia is now facing major health workforce shortages, increased demand, the aftermath of COVID-19 including delayed care and long COVID, and rising costs of providing healthcare. Additionally, the ability for Australia to maintain high workforce participation ― and therefore high economic output ― will be challenging in light of an ageing population with increased chronic disease.
For too long, health has been viewed as a cost to be managed rather than an investment to be made. If we are to reform our healthcare system, we must reframe our thinking and expand our focus from sickcare to holistic healthcare. The evidence is clear ― keeping people healthy reduces healthcare costs and the burden on our healthcare system, and it drives economic growth and productivity through increased workforce participation. Healthy individuals are also more likely to contribute to their communities, and spend into the economy, which benefits society more broadly. We therefore have both a moral and economic imperative to ensure every Australian has access to high-quality healthcare, regardless of their socioeconomic status, Indigenous status, or geographic location.
Achieving this goal, governments will need to look at how healthcare expenditure can be maximised to improve health outcomes and support economic growth. This will likely require a combination of increased expenditure and improved efficiency, however this investment ― whether it be in public health, primary care, public hospitals, private health, or future reform ― is an investment in our future and the wisest decision we can make as a nation. It will also require governments to adopt a more comprehensive approach to healthcare investment that extends beyond short-term political cycles and looks at broader economic outcomes, such as quality of life, wellbeing, and a thriving society. The AMA is committed to working with governments, healthcare professionals, and communities to achieve this paradigm shift in how we perceive and prioritise health.

REFERENCES
1 Australian Government Australian Institute of Health and Welfare (2023). Health expenditure Australia 2020–21. Retrieved 23/05/2023 from: https://www.aihw.gov.au/reports/health-welfare-expenditure/health-expenditure
2 Australian Government Australian Institute of Health and Welfare (2023). Health expenditure Australia 2020–21. Retrieved 23/05/2023 from: https://www.aihw.gov.au/reports/health-welfare-expenditure/health-expenditure
3 Australian Government Australian Institute of Health and Welfare (2023). Health expenditure Australia 2020–21. Retrieved 23/05/2023 from: https://www.aihw.gov.au/reports/health-welfare-expenditure/health-expenditure
4 Australian Government Australian Institute of Health and Welfare (2011-2023). Health expenditure Australia 2010–11 to 2020–21. Retrieved 23/05/2023 from: https://www.aihw.gov.au/reports/health-welfare-expenditure/health-expenditure
5 Parliament of Australia (2022). Parliamentary Budget Office Data portal. Retrieved 05/5/2023 from: https://www.aph.gov.au/About_Parliament/Parliamentary_departments/Parliamentary_Budget_Office/Data_portal
6 Australian Bureau of Statistics, September 2022, National, state and territory population, https://www.abs.gov.au/statistics/people/population/national-state-and-territory-population/sep-2022#data-downloads
7 Australian Government Australian Institute of Health and Welfare (2011-2023). Health expenditure Australia 2010–11 to 2020–21. Retrieved 23/05/2023 from: https://www.aihw.gov.au/reports/health-welfare-expenditure/health-expenditure
8 Organisation for Economic Co-operation and Development (2022). Life expectancy at birth. Retrieved 01/11/2022 from: https://data.oecd.org/healthstat/life-expectancy-at-birth.htm
9 Organisation for Economic Co-operation and Development (2022). Health spending. Retrieved 01/11/2022 from: https://data.oecd.org/healthres/health-spending.htm
10 Organisation for Economic Co-operation and Development (2022). Life expectancy at birth. Retrieved 01/11/2022 from: https://data.oecd.org/healthstat/life-expectancy-at-birth.htm
11 The Commonwealth Fund (2021). Mirror, Mirror 2021: Reflecting Poorly. Retrieved 15/05/2023 from: https://www.commonwealthfund.org/publications/fund-reports/2021/aug/mirror-mirror-2021-reflecting-poorly
12 Organisation for Economic Co-operation and Development (2019). Health at a Glance 2019: OECD Indicators. OECD Publishing, Paris. Doi: 10.1787/19991312. Retrieved 01/11/2022 from: https://www.oecd-ilibrary.org/social-issues-migration-health/health-at-a-glance-2019_4dd50c09-en
13 Organisation for Economic Co-operation and Development (2021). Health spending. Retrieved 01/11/2022 from: https://data.oecd.org/healthres/health-spending.htm
14 Australian Government Australian Institute of Health and Welfare (2022). Chronic conditions and multimorbidity. Retrieved 01/11/2022 from: https://www.aihw.gov.au/reports/australias-health/chronic-conditions-and-multimorbidity
15Australian Government Australian Institute of Health and Welfare (2022). Chronic conditions and multimorbidity. Retrieved 01/11/2022 from: https://www.aihw.gov.au/reports/australias-health/chronic-conditions-and-multimorbidity
16 Australian Institute of Health and Welfare (2022). Australian Burden of Disease Study 2022. Retrieved 04/05/2023 from: https://www.aihw.gov.au/reports/burden-of-disease/australian-burden-of-disease-study-2022/contents/about
17 Organisation for Economic Co-operation and Development (2022). Overweight or obese population. Retrieved 01/11/2022 from: https://data.oecd.org/healthrisk/overweight-or-obese-population.htm
18 Australian Bureau of Statistics (2022). Alcohol consumption. 04/05/2023 from: https://www.abs.gov.au/statistics/health/health-conditions-and-risks/alcohol-consumption/latest-release
19 Bhatta, D. N., & Glantz, S. A. (2020). Association of e-cigarette use with respiratory disease among adults: a longitudinal analysis. American journal of preventive medicine, 58(2), 182-190. Doi: 10.1016/j.amepre.2019.07.028
20 Greenhalgh, E.M., Scollo, M.M.,& Winstanley, M.H. (2023). Tobacco in Australia: Facts and issues. Melbourne: Cancer Council Victoria. Retrieved 04/05/2023 from: www.tobaccoinaustralia.org.au
21 Pettigrew, S., Miller, M., Santos, J. A., Raj, T. S., Brown, K., & Jones, A. (2023). E-cigarette attitudes and use in a sample of Australians aged 15–30 years. Australian and New Zealand Journal of Public Health, 47(2). Doi: 10.1016/j.anzjph.2023.100035
22 Australian Government Australian Institute of Health and Welfare (2022). Chronic conditions and multimorbidity. Retrieved 01/11/2022 from: https://www.aihw.gov.au/reports/australias-health/chronic-conditions-and-multimorbidity
23 Australian Government Australian Institute of Health and Welfare (2021). Health expenditure Australia 2019–20. Retrieved 01/11/2022 from: https://www.aihw.gov.au/reports/health-welfare-expenditure/health-expenditure-australia-2019-20/contents/summary
24 Parliament of Australia (2014). Australian National Preventative Health Agency (Abolition) Bill 2014. Retrieved 05/05/2023 from: https://www.aph.gov.au/Parliamentary_Business/Bills_Legislation/Bills_Search_Results/Result?bId=r5203
25 Stepanek, M., Hafner, M., Taylor, J., Grand-Clement, S., & van Stolk, C. (2017). The return on investment for preventative healthcare programmes. RAND Corporation. Retrieved 01/11/2022 from: https://www.rand.org/content/dam/rand/pubs/research_reports/RR1700/RR1787/RAND_RR1787.pdf
26 Australian Institute of Health and Welfare (2022). Australia’s hospitals at a glance. Retrieved 08/05/2023 from: https://www.aihw.gov.au/reports/hospitals/australias-hospitals-at-a-glance/contents/about
27 Australian Institute of Health and Welfare (2022). Australia’s hospitals at a glance. Retrieved 08/05/2023 from: https://www.aihw.gov.au/reports/hospitals/australias-hospitals-at-a-glance/contents/about
28 Australian Health Ministers’ Advisory Council (2015). National Elective Surgery Urgency Categorisation. Retrieved 08/05/2023 from: https://ranzcog.edu.au/wp-content/uploads/2022/05/National-Elective-Surgery-Categorisation.pdf
29 Australian Medical Association (2022). Shining a light on the elective surgery ‘hidden’ waiting list. Retrieved 04/05/2023 from: https://www.ama.com.au/elective-surgery-hidden-waiting-list
30 Scott, S., Sedghi, S., Florance, L. (2022. 5 July). GP wait times increase as Australia faces ‘perfect storm’ of flu, COVID, and doctor shorage. Australian Broadcasting Network. Retrieved 08/05/2023 from: https://www.abc.net.au/news/2022-07-05/gp-wait-times-getting-longer-as-doctor-shortage-grows/101205346
31 Le May, R. (2023, April 1). Breast cancer fears mount with months-long waits for ultrasounds, mammograms amid ‘COVID catch-up). The West Australian. Retrieved 25/05/2023 from: https://thewest.com.au/news/health/breast-cancer-fears-mount-with-months-long-waits-for-ultrasounds-mammograms-amid-covid-catch-up-c-10191403
32 Cunningham, M. (2022, November 6). Fears of late diagnoses as worker shortages blow out medical scan waitlists. The Age. Retrieved 25/05/2023 from: https://www.theage.com.au/national/victoria/cancers-diagnosed-late-as-worker-shortages-blow-out-medical-scan-waitlists-20221106-p5bvwd.html
33 Ostrom, V., & Ostrom, E. (2019). Public goods and public choices. Alternatives for delivering public services (pp. 7-49). Routledge.
34 Productivity Commission (2023). 5-year Productivity Inquiry: Keys to growth, Vol. 2, Inquiry Report no. 100 Retrieved 04/05/2023 from: https://www.pc.gov.au/inquiries/completed/productivity/report/productivity-volume2-keys-to-growth.pdf
35 Anomaly, J. (2021). What is public health? Public goods, publicized goods, and the conversion problem. Public Choice, 1-11. Doi: 10.1007/s11127-021-00908-8
36 Mankiw, N.G. (2017). The Economics of Healthcare. Harvard University. Retrieved 09/05/2023 from: https://scholar.harvard.edu/mankiw/publications/economics-healthcare
37 Australian Government Department of the Prime Minister and Cabinet, Office of Best Practice Regulation (2020). Best Practice Regulation Guidance Note Value of Statistical Life. Retrieved 09/05/2023 from: https://oia.pmc.gov.au/sites/default/files/2021-06/value-of-statistical-life-guidance-note-2.pdf
38 Whitehead, S. J., & Ali, S. (2010). Health outcomes in economic evaluation: the QALY and utilities. British medical bulletin, 96(1), 5-21. Doi: 10.1093/bmb/ldq033
39 Johnson, R., Jenkinson, D., Stinton, C., Taylor-Phillips, S., Madan, J., Stewart-Brown, S., & Clarke, A. (2016). Where’s WALY?: A proof of concept study of the ‘wellbeing adjusted life year’ using secondary analysis of cross-sectional survey data. Health and Quality of Life Outcomes, 14(1), 1-9. Doi: 10.1186/s12955-016-0532-5
40 Anand, S., & Hanson, K. (1997). Disability-adjusted life years: a critical review. Journal of health economics, 16(6), 685-702. Doi: 10.1016/S0167-6296(97)00005-2
41 Wolfson, M. C. (1996). Health-adjusted life expectancy. Health Reports-Statistics Canada, 8, 41-45.
42 Rechel, B., Jagger, C., McKee, M., & World Health Organization (2020). Living longer, but in better or worse health? European Observatory on Health Systems and Policies. Retrieved 09/05/2023 from: https://www.ncbi.nlm.nih.gov/books/NBK559813/
43 Suhrcke, M., McKee, M., Stuckler, D., Arce, R. S., Tsolova, S., & Mortensen, J. (2006). The contribution of health to the economy in the European Union. Public health, 120(11), 994-1001. Retrieved 16/05/2023 from: https://ec.europa.eu/health/archive/ph_overview/documents/health_economy_en.pdf
44 Suhrcke, M., McKee, M., Stuckler, D., Arce, R. S., Tsolova, S., & Mortensen, J. (2006). The contribution of health to the economy in the European Union. Public health, 120(11), 994-1001. Retrieved 16/05/2023 from: https://ec.europa.eu/health/archive/ph_overview/documents/health_economy_en.pdf
45 Henry, K., Harmer, J., Piggott, J., Ridout, H., & Smith, G. (2010). Australia’s Future Tax System Review, Final Report. Australian Government, The Treasury. Retrieved 09/05/2023 from: https://treasury.gov.au/review/the-australias-future-tax-system-review/final-report
46 Australian Bureau of Statistics (2022). National, state and territory population. Retrieved 04/05/2023 from: https://www.abs.gov.au/statistics/people/population/national-state-and-territory-population/latest-release
47 Australian Bureau of Statistics (2023). Labour Force, Australia. Retrieved 04/05/2023 from: https://www.abs.gov.au/statistics/labour/employment-and-unemployment/labour-force-australia-detailed/dec-2022
48 Australian Bureau of Statistics (2018). Population Projections, Australia. Retrieved 04/05/2023 from: https://www.abs.gov.au/statistics/people/population/population-projections-australia/latest-release
49 Australian Bureau of Statistics (2023). Labour Force, Australia, Detailed. Retrieved 30/05/2023 from: https://www.abs.gov.au/statistics/labour/employment-and-unemployment/labour-force-australia-detailed/latest-release#data-downloads
50 Australian Bureau of Statistics (2022). Australian National Accounts: National Income, Expenditure and Product. Retrieved 30/05/2023 from: https://www.abs.gov.au/statistics/economy/national-accounts/australian-national-accounts-national-income-expenditure-and-product/latest-release#data-downloads
51 Australian Bureau of Statistics (2023). Labour Force, Australia, Detailed. Retrieved 30/05/2023 from: https://www.abs.gov.au/statistics/labour/employment-and-unemployment/labour-force-australia-detailed/latest-release#data-downloads
52 Australian Institute of Health and Welfare (2022). Aged care data snapshot. Retrieved 30/05/2023 from: https://www.gen-agedcaredata.gov.au/Resources/Access-data/2022/October/Aged-care-data-snapshot%E2%80%942022
53 Australian Government Services Australia (2023). How much you can get. Retrieved 30/05/2023 from: https://www.servicesaustralia.gov.au/how-much-age-pension-you-can-get?context=22526
54 Australian Bureau of Statistics (2022). Australian National Accounts: National Income, Expenditure and Product. Retrieved 30/05/2023 from: https://www.abs.gov.au/statistics/economy/national-accounts/australian-national-accounts-national-income-expenditure-and-product/latest-release#data-downloads
55 Australian Bureau of Statistics (2023). Labour Force, Australia, Detailed. Retrieved 30/05/2023 from: https://www.abs.gov.au/statistics/labour/employment-and-unemployment/labour-force-australia-detailed/latest-release#data-downloads
56 Australian Institute of Health and Welfare (2022). Aged care data snapshot. Retrieved 30/05/2023 from: https://www.gen-agedcaredata.gov.au/Resources/Access-data/2022/October/Aged-care-data-snapshot%E2%80%942022
57 Australian Government Services Australia (2023). How much you can get. Retrieved 30/05/2023 from: https://www.servicesaustralia.gov.au/how-much-age-pension-you-can-get?context=22526
58 Australian Bureau of Statistics (2023). Labour Force, Australia. Retrieved 04/05/2023 from: https://www.abs.gov.au/statistics/labour/employment-and-unemployment/labour-force-australia-detailed/latest-release#data-downloads
59 Federal Reserve Bank of St. Louis. (2023). FRED, Economic Data, St. Louis FED, Employment-Population Ratio (EMRATIO). Retrieved 04/05/2023 from: https://fred.stlouisfed.org/series/EMRATIO
60 Australian Medical Association (2023). Public Hospital Report Card 2023. Retrieved 30/05/2023 from: https://www.ama.com.au/clear-the-hospital-logjam/phrc
61 Parliament of Australia (2014). Health Workforce Australia (Abolition) Bill 2014. Retrieved 27/05/2023 from: https://www.aph.gov.au/Parliamentary_Business/Bills_Legislation/bd/bd1314a/14bd077
62 Australian Bureau of Statistics (2022). Economic gains and losses over the COVID-19 pandemic. Retrieved 04/05/2023 from: https://www.abs.gov.au/articles/economic-gains-and-losses-over-covid-19-pandemic
63 Australian Institute of Health and Welfare (2022). Deaths in Australia, Life expectancy (expected age at death in years) at different ages by sex, 1881–1890 to 2018–2020. Retrieved 04/05/2023 from: https://www.aihw.gov.au/reports/life-expectancy-death/deaths-in-australia/data
64 Australian Institute of Health and Welfare (2022).Health across socioeconomic groups. Retrieved 30/05/2023 from: https://www.aihw.gov.au/reports/australias-health/health-across-socioeconomic-groups
65 Australian Institute of Health and Welfare (2022).Indigenous health and wellbeing. Retrieved 30/05/2023 from: https://www.aihw.gov.au/reports/australias-health/indigenous-health-and-wellbeing
66 Australian Institute of Health and Welfare (2022).Culturally and linguistically diverse Australians Retrieved 30/05/2023 from: https://www.aihw.gov.au/reports-data/population-groups/cald-australians/overview
67 Hafeez, H., Zeshan, M., Tahir, M. A., Jahan, N., & Naveed, S. (2017). Health care disparities among lesbian, gay, bisexual, and transgender youth: a literature review. Cureus, 9(4). Doi: 10.7759/cureus.1184
68 Australian Institute of Health and Welfare (2022). Rural and remote health. Retrieved 30/05/2023 from: https://www.aihw.gov.au/reports/rural-remote-australians/rural-and-remote-health
69 Australian Institute of Health and Welfare (2022).Health across socioeconomic groups. Retrieved 30/05/2023 from: https://www.aihw.gov.au/reports/australias-health/health-across-socioeconomic-groups
70 Australian Institute of Health and Welfare (2022). Australian Burden of Disease Study 2022. Retrieved 04/05/2023 from: https://www.aihw.gov.au/reports/burden-of-disease/australian-burden-of-disease-study-2022/contents/about
71 Australian Institute of Health and Welfare (2022). Australian Burden of Disease Study 2022. Retrieved 04/05/2023 from: https://www.aihw.gov.au/reports/burden-of-disease/australian-burden-of-disease-study-2022/contents/about
72 Australian Institute of Health and Welfare (2022). Deaths in Australia, Life expectancy (expected age at death in years) at different ages by sex, 1881–1890 to 2018–2020. Retrieved 04/05/2023 from: https://www.aihw.gov.au/reports/life-expectancy-death/deaths-in-australia/data
73 Australian Bureau of Statistics (2022). Regional population by age and sex, Statistics about the population by age and sex for Australia's capital cities and regions. Retrieved 04/05/2023 from: https://www.abs.gov.au/statistics/people/population/regional-population-age-and-sex/latest-release
74 Australian Institute of Health and Welfare, 23 November 2022, Health expenditure Australia 2020-21, https://www.aihw.gov.au/reports/health-welfare-expenditure/health-expenditure-australia/data
75 Dyakova, M. (2017). Investment for health and well-being: a review of the social return on investment from public health policies to support implementing the Sustainable Development Goals by building on Health 2020. World Health Organization. Retrieved 09/05/2023 from: https://apps.who.int/iris/handle/10665/326301
76 Morgan, D., & James, C. (2022). Investing in health systems to protect society and boost the economy: Priority investments and order-of-magnitude cost estimates. Retrieved 09/05/2023 from: https://www.oecd-ilibrary.org/social-issues-migration-health/investing-in-health-systems-to-protect-society-and-boost-the-economy_d0aa9188-en
77 World Economic Forum (2015). The importance of investing in health. Retrieved 09/05/2023 from: https://www.weforum.org/agenda/2015/12/the-importance-of-investing-in-health/
78 Productivity Commission (2017). Shifting the dial: 5 year productivity review. Retrieved 05/05/2023 from: https://www.pc.gov.au/inquiries/completed/productivity-review/report/2-healthier-australians
79 World Health Organization (2018). Building the economic case for primary health care: a scoping review. Retrieved 09/05/2023 from: https://www.who.int/publications/i/item/WHO-HIS-SDS-2018.48
80 Commonwealth of Australia (2023). Budget 2023-24, Budget Measures, Budget Paper No. 2. Retrieved 30/05/2023 from: https://budget.gov.au/content/bp2/download/bp2_2023-24.pdf
81 Australia Medical Association (2021). Public hospitals: Cycle of crisis. Retrieved 05/05/2023 from: https://www.ama.com.au/public-hospitals-cycle-of-crisis
82 Australian Medical Association (2022). Shining a light on the elective surgery ‘hidden’ waiting list. Retrieved 04/05/2023 from: https://www.ama.com.au/elective-surgery-hidden-waiting-list
83 Australian Institute of Health and Welfare (2022). Elective surgery. Retrieved 30/05/2023 from: https://www.aihw.gov.au/reports-data/myhospitals/sectors/elective-surgery
84 The cost of resolving the waiting list and hidden waiting list for elective surgery is the number of surgeries multiplied by the nationally efficient cost of a surgery ($6,032) completed over a two-year period with inflation of 1.8 per cent added to cost fee for the second year.
85 Australian Institute of Health and Welfare (2023). Hospital downloads. Retrieved 05/05/2023 from: https://www.aihw.gov.au/reports-data/myhospitals/content/data-downloads/hospital-downloads
86 Australian Institute of Health and Welfare (2022). Elective surgery. Retrieved 30/05/2023 from: https://www.aihw.gov.au/reports-data/myhospitals/sectors/elective-surgery
87 Victorian Agency for Health Information (2023). Victorian Health Services Performance. Retrieved 05/05/2023 from: https://vahi.vic.gov.au/reports/victorian-health-services-performance
88 Queensland Health (2023). Queensland Reporting Hospitals. Retrieved 05/05/2023 from: http://www.performance.health.qld.gov.au/Hospital/ElectiveSurgery/99999
89 Queensland Health (2023). Specialist Outpatient. Retrieved 05/05/2023 from: http://www.performance.health.qld.gov.au/Hospital/SpecialistOutpatient/99999
90 Government of Western Australia, Department of Health (2023). Elective Surgery Monthly Report. Retrieved 05/05/2023 from: https://www.health.wa.gov.au/Reports-and-publications/Elective-Surgery-Wait-List-ESWL-reports/Elective-Surgery-Monthly-Report,
91 New South Wales, Bureau of Health Information (2023). Data Portal. Retrieved 05/05/2023 from: https://www.bhi.nsw.gov.au/data-portal,
92 Government of South Australia, SA Health (2023). Elective surgery dashboard. Retrieved 05/05/2023 from: https://www.sahealth.sa.gov.au/wps/wcm/connect/public+content/sa+health+internet/about+us/our+performance/our+hospital+dashboards/about+the+elective+surgery+dashboard/elective+surgery+dashboard
93 Government of South Australia, SA Health (2023). SA Health Specialist Outpatient Waiting Time Report. Retrieved 05/05/2023 from: https://www.sahealth.sa.gov.au/wps/wcm/connect/public+content/sa+health+internet/about+us/our+performance/specialist+outpatient+waiting+time+report/specialist+outpatient+waiting+time+report
94 Tasmanian Government (2023). HealthStats, Health system dashboard. Retrieved 05/05/2023 from: https://healthstats.dhhs.tas.gov.au/healthsystem
95 ACT Government (2023). ACT Public Health Services Quarterly Performance Report. Retrieved 05/05/2023 from: https://www.health.act.gov.au/about-our-health-system/act-public-health-services-quarterly-performance-report
96 Victorian Agency for Health Information (2023). New appointments. Retrieved 05/05/2023 from: https://vahi.vic.gov.au/specialist-clinics/new-appointments?nid=8586
97 Australian Institute of Health and Welfare (2001–2007). Australian Hospital Statistics: Planned surgery data cubes (2001-02 to 2006-07). Retrieved 05/05/2023 from: https://www.aihw.gov.au/reports/hospitals/australian-hospital-statistics-2001-02/data
98 Australian Institute of Health and Welfare (2007–2022). Australian Hospital Statistics: Planned surgery waiting times (2007-08 to 2021-22). Retrieved 05/05/2023 from; https://www.aihw.gov.au/reports-data/myhospitals/content/data-downloads/hospital-downloads
99 Oudhoff, J. P., Timmermans, D. R. M., Knol, D. L., Bijnen, A. B., & Van der Wal, G. (2007). Waiting for elective general surgery: impact on health related quality of life and psychosocial consequences. BMC Public Health, 7(1), 1-10. Doi: 10.1186/1471-2458-7-164
100 Palmer, K. T., Milne, P., Poole, J., Cooper, C., & Coggon, D. (2005). Employment characteristics and job loss in patients awaiting surgery on the hip or knee. Occupational and environmental medicine, 62(1), 54-57. Doi: 10.1136/oem.2004.014977
101 Lost wages were calculated using waiting time statistics for elective surgery admissions, the number people waiting on the waiting list (calculated by the AMA), and average weekly earnings ($1,376.60)
Australian Bureau of Statistics (2022). Average Weekly Earnings, Australia, November 2022. Retrieved 05/05/2023 from: https://www.abs.gov.au/statistics/labour/earnings-and-working-conditions/average-weekly-earnings-australia/latest-release.
Australian Institute of Health and Welfare (2023). Hospitals info and downloads. Retrieved 04/05/2023 from: https://www.aihw.gov.au/reports-data/myhospitals/content/data-downloads/hospital-downloads
Australian Medical Association (2022). Shining a light on the elective surgery ‘hidden’ waiting list. Retrieved 04/05/2023 from: https://www.ama.com.au/elective-surgery-hidden-waiting-list
102 Phillip, P. J., Mullner, R., & Andes, S. (1984). Toward a better understanding of hospital occupancy rates. Health care financing review, 5(4), 53.
103 Janke, A. T., Melnick, E. R., & Venkatesh, A. K. (2022). Hospital occupancy and emergency department boarding during the COVID-19 pandemic. JAMA Network Open, 5(9). Doi: 10.1001/jamanetworkopen.2022.33964
104 Keegan, A. D. (2010). Hospital bed occupancy: more than queuing for a bed. Medical Journal of Australia, 193(5), 291-293. Doi: 10.5694/j.1326-5377.2010.tb03910.x
105 Australian Institute of Health and Welfare (2007–2022). Australian Hospital Statistics: Planned surgery waiting times (2007-08 to 2021-22). Retrieved 05/05/2023 from; https://www.aihw.gov.au/reports-data/myhospitals/content/data-downloads/hospital-downloads
106 Naylor, J.M., Mittal, R., Harris, I. & Xuan, W. (2017). The value of inpatient rehabilitation after uncomplicated knee arthroplasty: A propensity score analysis. Medical Journal of Australia 207(6), 250-255. Doi: 10.5694/mja16.01362.
107 Australian Orthopaedic Association National Joint Replacement Registry. 2022 Demographics of Hip, Knee and Shoulder Arthroplasty. Supplementary Report. p37. Retrieved 03/02/2023 from: https://aoanjrr.sahmri.com/documents/10180/732931/2022+Demographics+of+Hip%2C+Knee+and+Shoulder+Arthroplasty+SR
With the exception of a dip in 2020 during the COVID-19 pandemic.
108 Australian Orthopaedic Association National Joint Replacement Registry. 2022 Demographics of Hip, Knee and Shoulder Arthroplasty. Supplementary Report. Retrieved 03/02/2023 from: https://aoanjrr.sahmri.com/documents/10180/732931/2022+Demographics+of+Hip%2C+Knee+and+Shoulder+Arthroplasty+SR
109 Australian Orthopaedic Association National Joint Replacement Registry. Hip, Knee and Shoulder Arthroplasty. 2022 Annual Report. p198. Retrieved 03/02/2023 from: https://aoanjrr.sahmri.com/documents/10180/732916/AOA+2022+AR+Digital/f63ed890-36d0-c4b3-2e0b-7b63e2071b16; Australian Orthopaedic Association National Joint Replacement Registry. 2022 Demographics of Hip, Knee and Shoulder Arthroplasty. Supplementary Report. Retrieved 03/02/2023 from: https://aoanjrr.sahmri.com/documents/10180/732931/2022+Demographics+of+Hip%2C+Knee+and+Shoulder+Arthroplasty+SR
110 Royal Australasian College of Surgeons (2018). Rehabilitation Pathways Following Hip and Knee Arthroplasty: Final Report, January 2018. Retrieved 20/04/2023 from: https://www.surgeons.org/-/media/Project/RACS/surgeons-org/files/reports-guidelines-publications/surgical-variance-reports/2018-01-29_mbp_arthroplasty_final.pdf?rev=cad69a225fee486eadd75779bf7b8425&hash=8CC9E285C9E886440BCBA25A1A86F0ED
111 Naylor, J.M., Mittal, R., Harris, I. & Xuan, W. (2017). The value of inpatient rehabilitation after uncomplicated knee arthroplasty: A propensity score analysis. Medical Journal of Australia 207(6), 250-255. Doi: 10.5694/mja16.01362; Sattler, L., 112 Hing, W., Rathbone, E. & Vertullo, C. (2020). Intrinsic patient factors predictive of inpatient rehabilitation facility discharge following primary total knee arthroplasty: a systematic review and meta-analysis. BMC Musculoskeletal Disorders 21, 481. Doi: 10.1186/s12891-020-03499-5
113 Naylor, J.M., Mittal, R., Harris, I. & Xuan, W. (2017). The value of inpatient rehabilitation after uncomplicated knee arthroplasty: A propensity score analysis. Medical Journal of Australia 207(6), 250-255. Doi: 10.5694/mja16.01362.
The author cites personal communication with “two large private insurers in Australia”.
114 Naylor, J.M., Mittal, R., Harris, I. & Xuan, W. (2017). The value of inpatient rehabilitation after uncomplicated knee arthroplasty: A propensity score analysis. Medical Journal of Australia 207(6), 250-255. Doi: 10.5694/mja16.01362.
The author cites personal communication with “two large private insurers in Australia”.
115 Buhagiar, M.A., Naylor, J.M., Harris, I.A., Xuan, W., Kohler, F., Wright, R. & Fortunato, R. (2017). Effect of inpatient rehabilitation vs a monitored home-based program on mobility in patients with total knee arthroplasty: The HIHO randomized clinical trial. Journal of the American Medical Association 317(10), 1037-1046. Doi: 10.1001/jama.2017.1224
116 Meier, W., Mizner, R., Marcus, R., Dibble, L., Peters, C., & Lastayo, P. C. (2008). Total knee arthroplasty: muscle impairments, functional limitations, and recommended rehabilitation approaches. Journal of orthopaedic & sports physical therapy, 38(5), 246-256. Doi: 10.2519/jospt.2008.2715
117 Buhagiar, M.A., Naylor, J.M., Harris, I.A., Xuan, W., Kohler, F., Wright, R. & Fortunato, R. (2017). Effect of inpatient rehabilitation vs a monitored home-based program on mobility in patients with total knee arthroplasty: The HIHO randomized clinical trial. Journal of the American Medical Association 317(10), 1037-1046. Doi: 10.1001/jama.2017.1224
118 Naylor, J.M., Mittal, R., Harris, I. & Xuan, W. (2017). The value of inpatient rehabilitation after uncomplicated knee arthroplasty: A propensity score analysis. Medical Journal of Australia 207(6), 250-255. Doi: 10.5694/mja16.01362.
119 Naylor, J.M., Mittal, R., Harris, I. & Xuan, W. (2017). The value of inpatient rehabilitation after uncomplicated knee arthroplasty: A propensity score analysis. Medical Journal of Australia 207(6), 250-255. Doi: 10.5694/mja16.01362.
120 KPMG (2022). Medibank facilitates a sustainable healthcare system: The economic case of Medibank’s short-stay, no-gap program. Retrieved 17/03/2023 from: https://www.medibank.com.au/livebetter/newsroom/post/latest-report-reveals-a-solution-to-stretched-healthcare-system
121 Naylor, J.M., Mittal, R., Harris, I. & Xuan, W. (2017). The value of inpatient rehabilitation after uncomplicated knee arthroplasty: A propensity score analysis. Medical Journal of Australia 207(6), 250-255. Doi: 10.5694/mja16.01362.
122 Buhagiar, M.A., Naylor, J.M., Harris, I.A., Xuan, W., Kohler, F., Wright, R. & Fortunato, R. (2017). Effect of inpatient rehabilitation vs a monitored home-based program on mobility in patients with total knee arthroplasty: The HIHO randomized clinical trial. Journal of the American Medical Association 317(10), 1037-1046. Doi: 10.1001/jama.2017.1224
123 Naylor, J.M., Mittal, R., Harris, I. & Xuan, W. (2017). The value of inpatient rehabilitation after uncomplicated knee arthroplasty: A propensity score analysis. Medical Journal of Australia 207(6), 250-255. Doi: 10.5694/mja16.01362.
124 Services Australia (2023). Medicare Group Reports. Retrieved 05/05/2023 from: http://medicarestatistics.humanservices.gov.au/statistics/mbs_group.jsp
125 Australian Transport Assessment and Planning (2022). Infrastructure and Transport Ministers, Australian Transport Assessment and Planning Guidelines, M2 Roads. Retrieved 05/05/2023 from: https://www.atap.gov.au/mode-specific-guidance/road-transport/index
126 Travel time was calculated using available data to separate “regional” and “urban”. Regional populations were assumed to be anyone outside of major cities as defined by the Australian Bureau of Statistics. Urban travel was separated by mode. Modes included active transport (walking, bike), public transport, car, and other. Each mode was allocated an average travel time. All regional trips were assumed to be by car. The travel distance by car was estimated and multiplied by the Australian Transport Assessment and Planning cost per kilometre travelled. The cost of time travelled by other modes was calculated as 40 per cent of average weekly earnings. The benefit includes is apportioned as 60% travel time saving, six per cent fuel saving, one per cent tyres saving, 11 per cent vehicle depreciation, eight per cent reduced crashes, seven per cent environmental savings (note that rounding may alter numbers).
Australian Bureau of Statistics (2018). Census of population and housing: reflecting Australia: stories from the Census, 2016. Retrieved 05/05/2023 from: https://www.abs.gov.au/ausstats/abs@.nsf/Lookup/2071.0main+features1132016
Australian Bureau of Statistics (2022). Average Weekly Earnings, Australia, November 2022. Retrieved 05/05/2023 from: https://www.abs.gov.au/statistics/labour/earnings-and-working-conditions/average-weekly-earnings-australia/latest-release.
Victoria State Government, Department of Transport and Planning (2008–2020). Victorian Integrated Survey of Travel & Activity (VISTA). Retrieved 05/05/2023 from: https://public.tableau.com/app/profile/vista#!/,
NSW Government, Transport for NSW (2009–2020). Household Travel Survey (HTS) – Data by Region (2009/10 – 2019/20). Retrieved 05/05/2023 from: https://www.transport.nsw.gov.au/data-and-research/passenger-travel/surveys/household-travel-survey-hts/household-travel-survey-0
127 Department of Health and Aged Care (2023). General Practice Workforce providing Primary Care services in Australia. Retrieved 05/05/2023 from: https://hwd.health.gov.au/resources/data/gp-primarycare.html
128 The potential savings were calculated by assuming a reduction in general practitioner visits, and a reduction in the number of nights in hospitals (in both private and public hospitals) due to increased out-of-hospital care, remote monitoring, and the use of telemedicine for prevention and early intervention. The value of saving for general practitioner visits was calculated as the average saving per telehealth appointment ($31.16) from reduced travel. The hospital per night cost saving was estimated using the cost provided by Victoria State Government.
Independent Hospital and Aged Care Pricing Authority (2022). National Hospital Cost Data Collection (NHCDC), Private Hospital Report, Round 24 (financial year 2019–20). Retrieved 05/05/2023 from: https://www.ihacpa.gov.au/resources/national-hospital-cost-data-collection-nhcdc-private-hospital-report-round-24-financial-year-2019-20
Australian Institute of Health and Welfare (2022). Australia’s hospital at a glance. Retrieved 05/05/2023 from: https://www.aihw.gov.au/reports/hospitals/australias-hospitals-at-a-glance/contents/hospital-activity
Victoria State Government, Department for Health (2022). Overnight stays. Retrieved 08/05/2023 from: https://www.health.vic.gov.au/patient-fees-charges/overnight-stays